Variations in Mental Health Needs and Fee-for-Service Reimbursement for Physicians in Ontario
Abstract
Objectives: The study examined the match between mental health needs and physician fee-for-service reimbursements for mental health care within age and gender groups and health planning regions in Ontario, Canada. METHODS: Indicators of need (mental disorder, reported disability, and self-rated mental health) from an epidemiologic survey of 9,953 Ontario household residents were compared with per capita reimbursement rates derived from an administrative data set containing all fee-for-service expenditures for mental health care paid by the provincial health plan. RESULTS: Few gender differences were found in overall need, but need varied significantly by age. Those in greatest need were adolescent males and females, who had rates of need from two to four times higher than older respondents. Regional variations in need were less evident. By contrast, per capita reimbursement showed marked gender differences, with rates for women generally twice the rates for men. Considerable variations in reimbursement were also found across age groups; these variations did not match variations in need. Highly urbanized areas had per capita reimbursement rates between two and four times the rates for less populated areas. CONCLUSIONS: Despite Ontario's universal-access health care system, notable discrepancies between need and resource use are evident for males, adolescents, and residents of less urbanized areas. Solutions require a combination of public education, provider training, attention to physician availability and practice patterns, and continuous monitoring of how resources are allocated relative to need.
Development of measures of need to guide the allocation of mental health services is receiving considerable international attention (1,2,3,4,5,6,7). One objective is to steer away from old funding formulas, which often reflect past utilization patterns and thus entrench inefficient or inequitable resource distribution. Indeed, the literature reports a variety of factors unrelated to need that also predict mental health service use (8,9,10,11,12). However, with some exceptions (13,14,15,16), previous research has been unable to compare direct measures of need (assessed independently of treatment status) with actual utilization records. Furthermore, many studies have been limited to specific population subgroups, such as health plan enrollees.
Our report focuses on the relationship of mental health needs to mental health care expenditures in Ontario, a province in which nearly 40 percent of the Canadian population resides. This study is unique in two ways. First, the estimates of need include direct measures of psychiatric disorder from a provincewide representative sample of the general population. Second, our cost data set captures nearly all of the provincial mental health care dollars paid to a single health care sector (fee-for-service physicians) under a single-payer universal-access system. This sector provides the vast majority of the mental health care reported by the general population (17). It accounts for 33 percent of annual provincial mental health costs, second only to provincial psychiatric hospitals (34 percent) and followed by general hospitals (11 percent) (18).
This combination of epidemiologic and administrative data provides a comprehensive picture of a single jurisdiction and allows us to address two critical planning questions: Do levels of mental health need match the use of services? If not, where are the gaps?
Methods
Data sources
Epidemiologic data from the 1990-1991 Mental Health Supplement to the Ontario Health Survey provided the measures of need. This survey, which was conducted under the auspices of the Ontario Mental Health Foundation, assessed the prevalence of psychiatric disorder, disability, and self-reported use of mental health services in Ontario. Household residents across the province (age 15 and older) were randomly selected for a face-to-face interview. The 76.5 percent response rate yielded a sample of 9,953. Data were weighted to reconcile the sample's age and gender distributions with those of the 1991 census. Additional details about the survey design and methods are available elsewhere (19).
Reimbursement information was obtained from the National Physician Data Base (NPDB). This administrative data set contains quarterly summaries of all expenditures paid to fee-for-service physicians by the provincial health plan, the Ontario Health Insurance Plan (OHIP) (20,21). These data can be analyzed by fee code and a selected set of patient and physician characteristics. Because OHIP claims account for 95 percent of physician expenditures in Ontario (Brochu P, Ontario Ministry of Health, personal communication, 1995) and because Ontario provides universal coverage for both mental and physical illness, the NPDB provides comprehensive information about physician reimbursement for mental health services. The remaining 5 percent of physician expenditures include services covered by sessional fees—that is, reimbursement for indirect patient care—or provided by salaried physicians, such as those in provincial psychiatric hospitals, or by those practicing under alternate payments plans.
Measures of need
Because of strong arguments that single measures of need such as psychiatric diagnosis are insufficient (1,2), the Mental Health Supplement included several perspectives on need, with items about mental disorder, self-reported disability, and self-rated mental health. Mental disorder was assessed using the University of Michigan's version of the Composite International Diagnostic Interview (UM-CIDI) (22,23). This structured instrument, designed for administration by lay interviewers, derives DSM- III-R diagnoses (24) postinterview from respondents' symptom patterns. Our estimates of past-year mental disorder included affective disorders (dysthymia, depression, and mania), anxiety disorders (simple and social phobias, agoraphobia, panic disorder, and generalized anxiety disorder), and substance use disorders (alcohol and drug abuse and dependence), as well as bulimia, antisocial personality disorder, and conduct disorder (grouped as "other" disorders). Schizophrenia, while not considered separately because of the extremely small numbers of persons reporting this disorder, is included in the overall measure of past-year disorder.
Because of concerns that the lengthy interview (one and a half to two hours) might burden elderly respondents, persons age 65 and older received an abbreviated UM-CIDI. Consequently, data for this group were not included in the estimates of mental disorder; however, they were included in all other need measures.
Self-reported disability was measured in two ways. Respondents classified as having a main-activity disability reported difficulty in the previous six months performing their main activity (self-defined) or identified themselves as permanently unable to work. These difficulties could stem from any source, not just mental health problems. Individuals classified as having disability days reported one or more days during the previous 30 days when they were completely unable to function normally because of self-defined emotional-mental or substance use problems.
To tap self-rated mental health, respondents were asked to compare their mental health to that of others of the same age. Because of extreme skew (most rated their mental health as very good or excellent), we combined ratings of poor and fair for our analyses.
Reimbursement
Our analyses used 1992-1993 data from the National Physician Data Base. The database does not provide information about patients' diagnoses. However, the Ontario Ministry of Health has identified a set of service codes as mental health related (25). The codes cover psychotherapy and counseling; psychiatric assessments, visits, and consultations; electroconvulsive therapy; and certain general and specialty hospital procedures such as inpatient group or individual psychotherapy. Currently, no restrictions exist on the reasons for patients' needs for these services. However, it is expected that the reasons be related to mental health.
Analysis
Needs and expenditures are described for the total province and compared across age and gender groups and region. Data from the Mental Health Supplement are reported as unweighted numbers and weighted percentages. Because of the supplement's complex sampling design, standard errors and significance tests were calculated using SUDAAN procedures (26), with p levels set at .05. NPDB data are reported in actual dollars (Canadian) or as per capita rates.
Results
Overall need and expenditures
According to the 1990-1991 Mental Health Supplement, 19.5 percent of respondents between the ages of 15 and 64 had a mental disorder. In the full supplement sample, 13 percent had a main-activity disability, 1.2 percent had past-month disability days, and 4.2 percent rated themselves as having poor or fair mental health. Reimbursements related to mental health totaled $422.4 million dollars in 1992-1993, a figure equivalent to $39.68 per capita and 9.5 percent of the total fee-for-service health dollar.
Age and gender differences
Figure 1 shows the distribution of mental health need by age and gender groups. Age was significantly, and usually inversely, related to need. Compared with older respondents, those age 15 to 19 reported higher rates of mental disorder (28.7 percent for females and 34.9 percent for males), main-activity disability (26.0 percent for females and 37 percent for males), and disability days (3.4 percent for females and 1.1 percent for males).
The exception was self-rated mental health, in which the relationship was curvilinear. Respondents over age 65 reported the highest rates of poor-fair mental health (7.6 percent for women and 7.8 percent for men), followed by respondents age 15 to 19 (5.6 percent for females and 3.6 percent for males).
The only significant gender difference for overall need (not shown in Figure 1) was found for main-activity disability, with females reporting a higher rate than males (15.1 percent versus 10.8 percent; (χ2=17.63, df=1, plt;.001). Otherwise, the rates were similar: mental disorder, 19.8 percent for females versus 19.2 percent for males; disability days, 1.1 percent and 1.2 percent, respectively; and poor or fair self-rated mental health, 4.6 percent and 3.8 percent, respectively.
However, significant gender differences were found in relation to specific mental disorders. Compared with males, females were more likely to have affective disorders (5.2 percent versus 2.9 percent; (χ2=16.56, df=1, p<.001) and anxiety disorders (15.1 percent versus 8.8 percent; (χ2=29.36, df=1, p<.001), whereas males were more likely to have substance use disorders (7.5 percent versus 1.8 percent; (χ2=73.48, df=1, p<.001) and disorders in the category "other" (5.6 percent versus 2.1 percent; (χ2=32.91, df=1, p<.001).
When all these measures are considered together, the age-gender groups in greatest need were females and males age 15 to 19. Compared with women age 45 to 64, adolescent females had nearly twice the rate of mental disorder and main-activity disability and 17 times the rate of disability days. Adolescent males had four to five times more mental disorder or main-activity disability than men age 45 to 64 and 1.5 times the rate of disability days.
As shown in Figure 2, the 1992-1993 per capita spending rates also indicate marked age-gender variations. However, these variations did not match the need variations. Per capita reimbursement was roughly twice as high for the group age 20 to 44 ($37.86 for men and $70.31 for women) and the group age 45 to 64 ($39.78 for men and $64.30 women) than for adolescents ($17.17 for males and $31.52 for females) and persons age 65 and older ($22.78 for men and $30.26 for women). Men consistently used fewer services than women, with the largest gender gaps occurring in the groups age 20 to 44 and age 45 to 64.
Regional differences
Regional distributions of mental disorder, reported disability, and self-rated mental health are shown in Figure 3. Although some significant differences were found in mental disorder and disability days, regional variations were considerably narrower than those for age and gender. The highest rate of mental disorder (23.4 percent in the North) was only 1.4 times the lowest (16.6 percent in the Central East), and the highest rate of disability days (2 percent in the Southwest) was about 2.5 times the lowest (.8 percent in the Central West).
By contrast, regional expenditures varied considerably as shown in Figure 4. Per capita rates ranged from $13.74 and $22.48 in the North and Central West, respectively, to $50.01 and $50.73 in the Central East and East. Furthermore, need and spending patterns showed little correspondence. Of the two regions with the highest per capita spending, one (Central East) had the lowest proportions of respondents in need, and the other (East) fell in the middle-to-high range.
Regional expenditure rates are dependent, in part, on two factors: physician supply and each physician's practice volume devoted to mental health. An "active physician" is defined as a physician who bills at least $35,000 annually (20); the number of active physicians is a more useful measure of physician supply than the number of registered physicians. In Ontario the number of active physicians per 1,000 population in 1992-1993 ranged between 1.6 in the North region and 1.82 in the East region, with a particularly large difference for the number of psychiatrists (.03 per 1,000 in the North versus .20 in the East). Average physician billings also showed a wide variation, from a low of $11,800 in the North to a high of $29,600 in the Central East.
An obvious question is whether changing either physician supply or physician billing patterns might create more equitable fiscal distributions. These factors are not independent because the number of providers influences demand for service and referral-consultation possibilities and, consequently, average billings. However, for illustrative purposes, we have modeled the effect if each were standardized. Figure 5 (center and right bars) shows the resulting per capita rates if the numbers of general practitioners, psychiatrists, and other physicians per 1,000 population were held constant or the average mental health billings for these types of physician were held constant. In both cases, the Central East, where Metropolitan Toronto is located, was used as the standard. Neither adjustment eliminated the regional differences, but the regional rates are more even when the numbers of physicians per 1,000 population were controlled than when the billing patterns were held constant.
Discussion and conclusions
The rates of mental disorder and spending for mental health care in Ontario reported here are similar to other findings. The 19.6 percent one-year prevalence rate is consistent with the range of 20 to 30 percent found in general population studies(1,27,28,29).
The proportion of the fee-for-service health dollar spent on mental health in Ontario—9.5 to 10 percent—is more difficult to evaluate because few comparable studies have been published. Eight percent of Ontario's overall health budget, including fee-for-service expenditures, is spent on mental health (18), a figure well within the range reported by other jurisdictions with universal coverage—4 to 6 percent in New Brunswick (30) and 12 percent in the United Kingdom (31)—and by those without such coverage—8 percent of U.S. outpatient care expenditures (32).
We found that gender was not a significant predictor of overall need, except for main-activity disability. However, gender did predict specific types of mental disorder. Age showed inverse or curvilinear relationships with need depending on the measure. In all cases, adolescent females and males had higher rates of need—as much as two to four times higher—than men and women age 45 to 64. Elderly respondents (age 65 and older) showed a mixed picture, reporting the lowest percentages for the disability measures but the highest percentages of poor-fair self-rated mental health. By contrast, need was more evenly distributed across planning regions, which was not surprising because regions had similar age-gender profiles.
In needs-based planning, the desired goal is a match between need and service use. Even though Ontario has universal health care, our data show significant departures from this ideal, particularly for males, adolescents, and residents of less urban areas. Women used more service dollars than men, consistent with the frequently reported finding that they are more likely to use health care (8,26,33,34,35. The relationship of age to spending was curvilinear, but in the opposite direction of the relationship with need. Adults age 20 to 64 used more per capita fee-for-service dollars than either adolescents or elderly persons, again reflecting the lower rates of help-seeking reported for adolescents and elderly persons 8,26,36. The largest number of per capita dollars spent were for services to women, particularly those age 20 to 64, a pattern not unique to Ontario (8).
Regionally, the highest per capita spending for mental health occurred in the planning areas containing the two largest urban centers. Their spending rates were nearly four times those of the lowest planning areas, a striking discrepancy given the narrower variations in need between regions.
The question of how these gaps should be interpreted has no simple answer. One possibility is that they reflect true areas of unmet need. Groups such as males and adolescents may underutilize health services in general, of which mental health services are a specific case. Supporting evidence comes from the vast literature showing gender differences in service use, as well as data from Ontario showing that per capita spending rates for physical health for males and adolescents are also lower than rates for females and persons who have reached adulthood (37).
Unmet need may also be a consequence of the health care system itself. Our analyses focused on physician supply and billing patterns and suggest that all else being equal, the former contributes more than the latter to uneven resource allocation.
Another possibility is that the gaps between need and spending are artifacts of our methodology or sampling. For example, although fee-for-service physicians are the second largest component of Ontario's mental health system, they are not the only providers of service. Previous analyses have shown only limited regional offset effects due to general and psychiatric hospitals (18), but use of other professionals in community health centers, through private insurance, or out-of-pocket payments—although markedly less in Canada than in the U.S.—may have some impact. Similarly, adolescents may receive care through educational and children's services and men through other sectors, such as self-help groups specializing in substance use disorders. However, determining whether such offset effects exist in Ontario and what their magnitude might be must await the collection of systematic data from these sectors.
Another methodological explanation is that severity of need was not adequately measured. The Mental Health Supplement did not sample groups such as institutionalized individuals that have been reported to include disproportionately high users of mental health services (38,39). Even among the general population respondents, our summary measures may have obscured important differences in levels of need. For example, diagnosis covered a range from mild anxiety disorders to severe depression and psychotic major depression.
Hospital census data and bed availability data suggest that the proportion of Ontarians hospitalized for psychiatric reasons is quite small (.05 percent) (40). Taking this group into consideration would have added only minimally to the percentage of respondents to the Mental Health Supplement who were categorized as in need. Extremely high use of fee-for-service physicians by this group when not hospitalized might partially explain the regional billing variations and possibly the male-female disparity, although studies have found conflicting results about gender differences among heavy service users (38,39,41,42).
Because of limitations of the National Physician Data Base, spending could not be disagreggated by patient diagnosis. However, data from the Mental Health Supplement does suggest that at least for the general population, severity of need alone cannot explain our findings. Few gender differences were found for self-reported disability rates and poor-fair mental health; gender differences were most pronounced for respondents age 15 to 19, one of the groups with the lowest per capita reimbursement.
Other analyses of data from the supplement (43; Parikh S, Lin E, Kennedy SH, et al, unpublished manuscript, 1997) have found little relationship between severity of illness, as measured by symptom level among depressed persons or by an index of nondisorder indicators among those with no past-year diagnosis, and frequency of mental health care visits.
Several limitations of our data exist, and thus some cautions should be raised in interpreting our results. One important factor, particularly for elderly persons, may be methodological. The literature indicates that structured diagnostic interviews, such as the Composite International Diagnostic Interview, do a poor job of detecting mental illness in the elderly population (44,45), and some evidence suggests that the true prevalence of psychiatric disorder in this group is considerably higher than reported rates (46,47). If so, then the incongruence between need and resources may be even greater for elderly persons than our data indicate.
Perhaps the most critical limitation is that our data are cross-sectional and unlinked. Although we could identify respondent groups with higher or lower need and patient groups with higher or lower per capita spending, we do not know whether individuals with a high level of need were the ones receiving more services. Similarly, we cannot address how appropriate or successful the delivered treatment was. The necessity of gathering such information is underscored by the fact that our findings could indicate several possible scenarios. They could reflect a poor need-resources match, with the least needy receiving treatment and the most needy not receiving it. Alternatively, they could indicate that the health care system has effective treatments but limited capacity because it is underresourced. Or, both scenarios might be true. Each interpretation leads to very different policy and budget implications, and definitive testing requires longitudinal tracking of needs, service use, and outcomes at an individual level.
In terms of planning, the question of how to reconcile need and use is a complex one. One solution, albeit improbable in the current economic climate, is increasing resources to reach underserved groups. A more likely alternative is better targeting within current fiscal limits. Because of the complexity of the problem, improved targeting requires multiple approaches aimed at planners, providers, and the general public. Public education focused on underserved groups and areas (including adolescents, males, less urbanized regions, and, most likely, the elderly), training of providers to recognize and address their special needs, and efforts to distribute physicians more evenly and make more effective use of existing psychiatric expertise are all required. In addition, continuous monitoring of the match between needs and service use and of systemwide and individual outcomes will provide valuable information allowing planners to evaluate and improve resource allocation.
Acknowledgments
The authors thank Mohammed Agha, M.Sc., and Isobel Barnes, M.Sc., for technical assistance.
Dr. Lin is research scientist in the health systems research unit at the Centre for Addiction and Mental Health, Clarke Division, 250 College Street, Toronto, Ontario M5T 1R8, Canada (e-mail, [email protected]). She is also assistant professor in the department of psychiatry at the University of Toronto. Dr. Chan is scientist at the Institute for Clinical Evaluative Sciences and assistant professor in the department of health administration and preventive medicine at the University of Toronto. Dr. Goering is director of the health systems research unit at the Centre for Addiction and Mental Health and professor in the department of psychiatry, the faculty of nursing, and the Institute of Medical Sciences at the university. Portions of this paper were presented at the annual meeting of the American Evaluation Association, held November 6-9, 1996, in Atlanta.
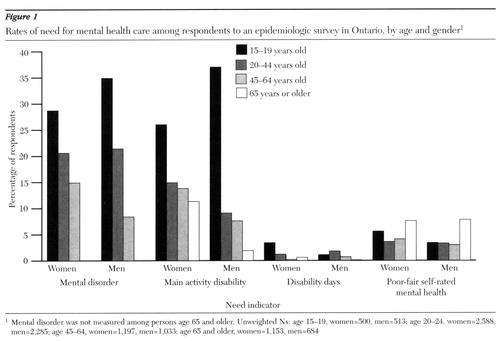
Figure 1. Rates of need for mental health care among respondents to an epidemiologic survey in Ontario, by age and gender1
1 Mental Disorder was not measured among persons age 65 and olderUnweighted Ns: age 15-19, women=500, men=513; age 20-24, women=2,588, men=2,285: age 45-64, women=1,197, men=1,033; age 65 and older, women=1,153, men=684
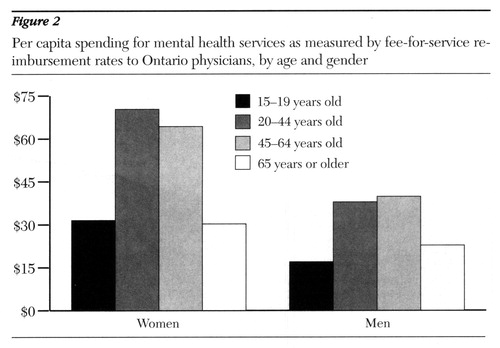
Figure 2. Per capita spending for mental health services as measured by fee-for-service reimbursement rates to Ontario physicians, by age and gender
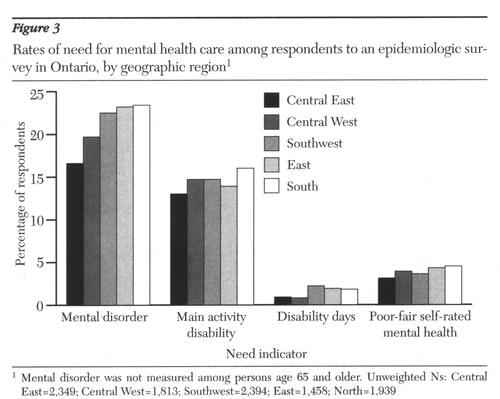
Figure 3. Rates of need for mental health care among respondents to an epidemiologic survey in Ontario, by geographic region1
1 Mental Disorder was not measured among persons age 65 and older Central East=2,349, Central West=1,813, Southwest=2,394, East=1,458, North=1,939
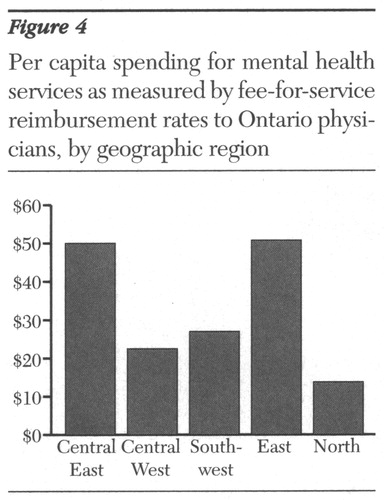
Figure 4. Per capita spending for mental health service as measured by fee-for-service reimbursement rates to Ontario physicians, by geographic region
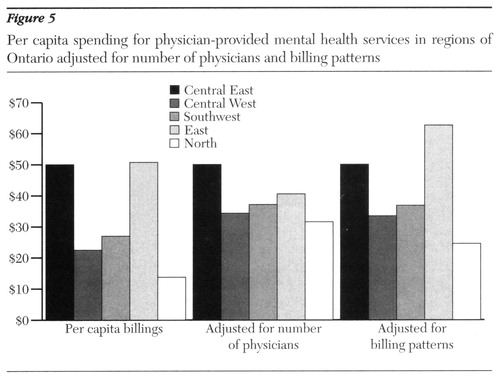
figure 5. Per capita spending for physician-provided mental health services in regions of Ontario adjusted for number of physicians and billing patterns
1. Klerman GL, Olfson M, Leon AC, et al: Measuring the need for mental health care. Health Affairs 11(3):23-33, 1992Google Scholar
2. Bebbington PE: Population surveys of psychiatric disorders and the need for treatment. Social Psychiatry and Psychiatric Epidemiology 25:33-40, 1990Medline, Google Scholar
3. Brewin CR, Wing JK: The MRC needs for care assessment: progress and controversies. Psychological Medicine 23:837-841, 1993Crossref, Medline, Google Scholar
4. Holley HL, Kulczycki G, Arboleda-Flórez J: Case-mix funding and legislated psychiatric care. International Journal of Law and Psychiatry 17:377-393, 1994Crossref, Medline, Google Scholar
5. Ciarlo JA, Shern DL, Tweed DL, et al: The Colorado social health survey of mental health service needs: sampling, instrumentation, and major findings. Evaluation and Program Planning 15:133-147, 1992Crossref, Google Scholar
6. Lehtinen V, Joukama M, Jyrkinen E, et al: Need for mental health services of the adult population in Finland: results from the Mini Finland Health Survey. Acta Psychiatrica Scandinavica 81:426-431, 1990Crossref, Medline, Google Scholar
7. Lesage AD, Mignoli G, Faccincani C, et al: Standardized assessment of the needs for care in a cohort of patients with schizophrenic psychoses. Psychological Medicine 19(monograph suppl):27-33, 1991Google Scholar
8. Wells KB, Manning WG, Duan N, et al: Sociodemographic factors and the use of outpatient mental health services. Medical Care 1:75-85, 1986Crossref, Google Scholar
9. Rhodes AR, Goering P: Gender differences in the use of outpatient mental health services. Journal of Mental Health Administration 21:338-345, 1994Crossref, Medline, Google Scholar
10. Padgett DK, Patrick C, Burns BJ, et al: Ethnicity and the use of outpatient mental health services in a national insured population. American Journal of Public Health 84:222-226, 1994Crossref, Medline, Google Scholar
11. Crow MR, Smith HL, McNamee AH, et al: Considerations in predicting mental health care use: implications for managed care plans. Journal of Mental Health Administration 21:5-23, 1994Crossref, Medline, Google Scholar
12. Wells KB, Manning WG, Duan N, et al: Sociodemographic factors and the use of outpatient mental health services. Medical Care 1:75-85, 1986Crossref, Google Scholar
13. Tarlov AR, Ware JE Jr, Nelson EC, et al: The Medical Outcomes Study. JAMA 262:925-930, 1989Crossref, Medline, Google Scholar
14. Ware JE Jr, Manning WG, Duan N, et al: Health status and the user of outpatient mental health services. American Psychologist 39:1090-1100, 1984Crossref, Medline, Google Scholar
15. Simon GE, VonKorff M, Durham ML: Predictors of outpatient mental health utilization by primary care patients in a health maintenance organization. American Journal of Psychiatry 151:908-913, 1994Link, Google Scholar
16. Diehr P, Price K, Williams SJ, et al: Factors related to the use of ambulator mental health services in three provider plans. Social Science and Medicine 23:663-780, 1986Crossref, Google Scholar
17. Lin E, Goering PN, Offord DR, et al: The use of mental health services in Ontario: epidemiologic findings. Canadian Journal of Psychiatry 41:572-577, 1996Crossref, Medline, Google Scholar
18. Goering P, Lin E: Mental health: levels of need and variations in service use in Ontario, in Patterns of Health Care in Ontario, 2nd ed. Edited by Goel V, Williams JI, Anderson GM, et al. Ottawa, Canadian Medical Association, 1996Google Scholar
19. Boyle MH, Offord DR, Campbell D, et al: Mental Health Supplement to the Ontario Health Survey: methodology. Canadian Journal of Psychiatry 41:549-558, 1996Crossref, Medline, Google Scholar
20. Schedule of Benefits: Physician Services Under the Health Insurance Act. Toronto, Ontario Ministry of Health, 1992Google Scholar
21. National Physician Database: Functional Specifications manual. Ottawa, Ontario, Canadian Institute for Health Information, March 1966Google Scholar
22. Kessler RC, McGonagle KA, Zhao S, et al: Lifetime and 12-month prevalence of DSM-III-R psychiatric disorders in the United States. Archives of General Psychiatry 15:8-19, 1994Crossref, Google Scholar
23. Wittchen H-U: Reliability and validity studies of the WHO-Composite International Diagnostic Interview (CIDI): a critical review. Journal of Psychiatric Research 28:57-84, 1994Crossref, Medline, Google Scholar
24. Diagnostic and Statistical Manual of Mental Disorders, 3rd ed, rev. Washington, DC, American Psychiatric Association, 1987Google Scholar
25. Regional Allocation of Estimated Expenditures of Mental Health and Addictions Services (Fiscal Year 1992-93). Report of the Information, Planning and Evaluation Branch, Health Strategies Group. Toronto, Ontario Ministry of Health, March 1995Google Scholar
26. Shah BV, Barnwell BG, Bieler GS: SUDAAN User's Manual, Release 7.0. Research Triangle Park, NC, Research Triangle Institute, 1996Google Scholar
27. Regier DA, Farmer ME, Rae DS, et al: Comorbidity of mental disorders with alcohol and other drug abuse: results from the Epidemiologic Catchment Area (ECA) study. JAMA 264:2511-2518, 1990Crossref, Medline, Google Scholar
28. Bland RC, Newman SC, Orn H: Period prevalence of psychiatric disorders in Edmonton. Acta Psychiatrica Scandinavica 77(suppl 338):33-42, 1988Google Scholar
29. Oakley-Browne MA, Joyce PR, Wells JE, et al: Christchurch psychiatric epidemiology study, part II: six-month and other period prevalences of specific psychiatric disorders in the Christchurch urban area. Australia and New Zealand Journal of Psychiatry 23:327-340, 1989Crossref, Medline, Google Scholar
30. The Status of Mental Health Reform in New Brunswick: An Evaluation Carried out for the Mental Health Commission of New Brunswick. Shediac, New Brunswick, PGF Consultants, Inc, May 1994Google Scholar
31. Knapp M: Cost effectiveness, accountability, and their relationship to alternative fiscal mechanisms: results from Great Britain. Keynote address, Proceedings of the Mental Health and Fiscal Reform Workshop, Mental Health Policy Research Group, Toronto, Ontario, Feb 10, 1997Google Scholar
32. Olfson M, Pincus HA: Outpatient psychotherapy in the United States: I. volume, costs, and user characteristics. American Journal of Psychiatry 151:1281-1288, 1994Link, Google Scholar
33. Olfson M, Pincus HA: Measuring outpatient mental health care in the United States. Health Affairs 13(5):172-180, 1994Google Scholar
34. Leaf PJ, Livingston MM, Tischler GL, et al: Contact with health professionals for the treatment of psychiatric and emotional problems. Medical Care 23:1322-1337, 1985Crossref, Medline, Google Scholar
35. Broman CL, Joffman WS, Hamilton VL: Impact of mental health services use upon subsequent health of autoworkers. Journal of Health and Social Behavior 35:80-95, 1994Crossref, Medline, Google Scholar
36. Shapiro S, Skinner EA, Kramer M, et al: Measuring need for mental health services in a general population. Medical Care 23:1033-1043, 1985Crossref, Medline, Google Scholar
37. Anderson GM, Chan B, Carter JA, et al: An overview of trends in the use of acute care hospitals, physician and diagnostic services, and prescription drugs, in Patterns of Health Care in Ontario, 2nd ed. Edited by Goel V, Williams JI, Anderson GM, et al. Ottawa, Canadian Medical Association, 1996Google Scholar
38. Geller JL: A report on the "worst" state hospital recidivists in the US. Hospital and Community Psychiatry 43:904-908, 1992Abstract, Google Scholar
39. Kent S, Fogarty M, Yellowlees P: Heavy utilization of inpatient and outpatient services in a public mental health service. Psychiatric Services 46:1254-1257, 1995Link, Google Scholar
40. Estimating the Utilization of Inpatient Beds in a Reformed System of Care: Report to the Ontario Ministry of Health. Toronto, Clarke Institute Consulting Group, March 1994Google Scholar
41. Kent S, Fogarty M, Yellowlees P: A review of studies of heavy users of psychiatric services. Psychiatric Services 46:1247-1253, 1995Link, Google Scholar
42. Hansson L, Sandlund M: Utilization and patterns of care in comprehensive psychiatric care organizations. Acta Psychiatric Scandinavica 86:255-261, 1992Crossref, Medline, Google Scholar
43. Lin E, Goering PN, Lesage A, et al: Epidemiologic assessment of overmet need in mental health care. Social Psychiatry and Psychiatric Epidemiology 32:355-362, 1997Crossref, Medline, Google Scholar
44. Tweed DL, Blazer DG, Ciarlo JA: Psychiatric epidemiology in elderly populations, in The Epidemiologic Study of the Elderly. Edited by Wallace RB, Woolson RF. New York, Oxford University Press, 1992Google Scholar
45. Knäper B, Wittchen H-U: Diagnosing major depression in the elderly: evidence for response bias in standardized diagnostic interviews? Journal of Psychiatric Research 28:147-164, 1994Google Scholar
46. Burville PW: An appraisal of the NIMH Epidemiologic Catchment Area program. Australian and New Zealand Journal of Psychiatry 21:175-184, 1987Crossref, Medline, Google Scholar
47. Koenig HG, Blazer DG: Epidemiology of geriatric affective disorders. Clinics in Geriatric Affective Disorders 8:235-251, 1992Google Scholar


