Predicting Outcomes of Primary Care Patients With Major Depression: Development of a Depression Prognosis Index
Depression is an illness with staggering personal, clinical, and societal costs and high prevalence in primary care settings ( 1 , 2 , 3 , 4 , 5 ). The heterogeneity of patients with depression in primary care is a major issue affecting how policy makers, clinicians, and researchers plan for and evaluate depression treatment. Depression treatment improvement studies usually address heterogeneity through case mix adjustment of analyses, using a variable mixture of demographic characteristics and comorbidities ( 6 , 7 , 8 ). This approach, however, cannot produce valid estimates of the impact of the case mix adjustors either individually or as a group on outcomes.
In contrast, prognostic or risk stratification indices identify a set of characteristics that produce an estimate of the relative probability that an individual or group will experience a poor outcome at a later time ( 9 ). Such indices, if systematically developed and validated, can minimize threats to research validity resulting from unmeasured case mix and standardize comparisons across different studies ( 10 ). Prognostic indices are also clinically useful for assessing patient needs ( 11 , 12 , 13 , 14 ) and predicting hospital charges ( 15 ) and as the basis for developing clinical rules or heuristics ( 16 , 17 ). This article reports the development and validation of a Depression Prognosis Index (DPI) for predicting likelihood of recovery from depression over a six-month period among primary care patients.
Prognostic indices are commonly used in medical studies ( 9 , 15 , 18 , 19 , 20 , 21 , 22 , 23 ) as well as in medical settings such as intensive care units ( 19 ). These indices are less commonly used in mental health care or research. Efforts to increase the effectiveness of mental health care for diverse populations and settings, however, will demand better prognostication. For example, individualizing care for subpopulations on the basis of important prognostic indicators holds promise for improving cost-effectiveness ( 24 ) and is consistent with stepped-care models of collaboration between mental health and primary care ( 6 ). On a practical level, analysis of data gathered from heterogeneous settings typically involves multilevel models ( 8 , 25 , 26 ) with patients clustered within clinicians, practices, and organizations. The inclusion of a single valid prognostic value in analyses, instead of a long list of separate adjustors, can improve the stability and performance of regression models while improving adjustment for case mix ( 9 ).
Depression prognosis is affected by factors beyond the severity of depression symptoms, such as those identified by DSM-IV diagnostic criteria. A growing literature on treatment-resistant depression, for example, identifies additional factors that affect failure to recover despite appropriate treatment ( 27 , 28 ). Still other patient characteristics affect whether patients successfully access and complete treatment—the main quality deficit in primary care for depression ( 29 ). Our analyses addressed both characteristics related to treatment resistance and characteristics related to failure to initiate or complete treatment.
To carry out our analyses, we used secondary data from a representative sample of 1,471 primary care patients with depression who were cared for by 108 geographically and structurally diverse primary care practices. We systematically identified patient characteristics that best predicted depression outcomes six months after detection of major depression from each of five domains: physical, mental, and social health status; demographic characteristics; and treatment history.
This study extends previous research findings by developing and rigorously validating a depression prognosis measure. Validated measures of this kind are appropriate for immediate use but should be used judiciously; most commonly used prognostic indices have continued to be refined over a decade or more ( 18 ). On the basis of previous research ( 9 ), demonstrating that a prognostic index accounts for at least 20% of the variance in outcomes in a validation sample (that is, has an R 2 greater than .20) is a reasonable standard for considering an index to be potentially useful and worthy of continued development.
Methods
A more detailed description of methodologic and analytic procedures is available in monograph form ( 30 ). All study procedures were approved by institutional review boards at RAND as well as at participating organizations.
Sample and data
The DPI is based on data from the Quality Improvement in Depression study (QID), a group of four depression care improvement studies that collected uniform baseline data in 1996–1997 from 1,471 representative patients with major depression from 108 practices in 11 states ( 31 ). QID used encouragement methods to help practices adopt strategies for increasing the proportion of their patients who received guideline-concordant depression care ( 31 ).
Each study enrolled a representative cross-section of adult patients with current major depression by approaching consecutive patients attending primary care appointments and screening them for eligibility by using items from the World Health Organization's 12-month Composite International Diagnostic Interview (CIDI) ( 32 ). Patients were excluded if they had an acute life-threatening condition or cognitive impairment; indicated that they did not intend to receive care in the clinic on a ongoing basis; had no access to a telephone; were currently pregnant, breastfeeding, or less than three months postpartum; or screened positive for current bereavement, lifetime mania, or severe current alcohol abuse. All patients with major depression or dysthymia based on the full CIDI were enrolled (1,471 patients). In addition, two of the four studies enrolled 321 additional patients meeting criteria for subthreshold depression.
All four projects then collected self-reported data for enrolled patients at baseline and six months later either by telephone (Hopkins Quality Improvement for Depression, the Mental Health Awareness Project, and the Quality Enhancement by Strategic Teaming Project) or by self-report mail survey with telephone follow-up as needed (Partners in Care). Detailed methods are published elsewhere ( 31 ) and available upon request from the authors.
Outcome measures
Our primary outcome measure was depression symptom severity at the six-month follow-up. It was measured by the Center for Epidemiologic Studies Depression Scale to which slight modifications were made to more closely approximate DSM-IV criteria ( 33 , 34 ) (mCESD). We also measured the presence or absence of persistent depression at six months ( 35 ). This dichotomous variable indicates a likely diagnosis of current major depression on the basis of whether the patient scored in the depressed range on each of three measures: the mCESD, the mental health composite score of the 12-item Short Form Health Survey (MCS-12) ( 36 ), and stem items from the World Health Organization's CIDI assessing current "probable depression" ( 32 ). On the MCS-12 a score of more than 1 standard deviation below the general population mean of 50 falls in the depressed range. For the mCESD the depressed range was above a cutoff point of 20, which is equivalent to the standard cutoff point of 16 on the original CESD ( 37 ).
Predictors of poor prognosis
Our database included a majority of factors previously identified or theoretically postulated as predictors of depression outcomes. We conceptualized prognosis as being based on physical, mental, and social health status, demographic characteristics, and treatment history and identified these as domains of poor prognosis for our analyses. Among physical health factors, prior evidence identified a larger number of comorbid general medical problems as a negative prognostic factor ( 38 , 39 , 40 ). Among mental health factors, severe initial depression symptoms, psychiatric comorbidities, and a history of depression treatment have been associated with poor prognosis ( 41 , 42 ). Among social health factors, low social functioning and support worsen prognosis, as do the demographic factors of being older and male, having low educational attainment, or being unemployed or a member of a racial or ethnic minority group ( 40 , 43 , 44 , 45 , 46 , 47 , 48 ). Below are listed key variables included in our analyses from each domain. A complete list of candidate variables is available elsewhere ( 30 ).
Physical health. Physical health was measured by severity of symptoms common among people with depression. A scale indicating degree of interference with usual activities from five common physical health complaints—nausea or upset stomach, daytime sleepiness, dizziness or lightheadedness, difficulty urinating, and sexual dysfunction—was used. Measures of physical functioning were based on the 36-item Short Form Health Survey (SF-36) ( 49 , 50 ). The number of chronic general medical problems was documented ( 35 ), as was the level of pain ( 49 , 50 ).
Mental health. Current and past depression symptoms and history were obtained from the mCESD ( 34 ) and CIDI ( 32 ). Also documented were depression symptoms lasting longer than two years, a history of suicide attempts, anxiety, panic, irritability or anger, and the quantity and frequency of alcohol consumption ( 51 ).
Social health. The SF-36 was used to measure work status and functioning and limitations in household activities ( 49 , 52 ). Social support was measured with a nine-item subset from the Medical Outcomes Study Social Support Survey ( 53 ). Participants were asked whether they perceived that health interfered with social activities. They were also asked about negative life events ( 54 ).
Demographic characteristics. Information was obtained about income, education, ethnicity, and time and miles to access primary health care, mental health care, a pharmacy, and a hospital.
Past process of physical and mental health care. Data were collected on use of antidepressant medications, mental health counseling, and medical care before study enrollment ( 55 , 56 , 57 ).
Analysis
Analyses aimed to identify a parsimonious, clinically meaningful index comprising a set of predictive variables linked to regression weights that could be applied to measure prognosis for any patient population with minimal if any deterioration in prediction. We used the sample of 1,471 patients with major depression to develop the index. We used weighting and multiple imputation to maximize the index's accuracy for difficult-to-survey subpopulations that tend to generate more missing data than others, even when overall response rates are high (such as members of minority groups). We used a systematic stepwise clinical model-driven variable reduction process to reduce the likelihood that variable selection would be influenced by unpredictable effects of collinearity. Finally, we used a statistically robust split-sample validation approach ( 58 ) to maximize the generalizability of our findings.
Data reduction. Data were analyzed with SAS ( 59 ). We randomly selected one-third of study patients as a test or training sample for development of preliminary prognostic models ( 58 ). Using SAS PROC REG, we first selected all variables within each poor-prognosis domain (for example, social health) that predicted six-month depression symptom severity (mCESD at p<.20). We entered selected variables into "mini" stepwise regressions (SAS PROC REG, option stepwise) predicting symptom severity within each domain. We entered the final candidate variables that were significant at p<.15 in the miniregressions into a combined stepwise regression and retained all predictors significant at p<.05. We then eliminated variables with the lowest partial R 2 values (that is, <.012).
Validation and final scoring. We cross-validated the preliminary, or test sample, DPI on the remaining two-thirds of the sample by using the regression coefficients from the two preliminary models as weights and assessing their predictive validity when applied to the remaining two-thirds. We also tested the validity of the model in subgroups: separate samples from each of the four QID studies, only patients who received the study intervention, only patients who did not receive the study intervention, and only patients who began their depression treatment episode at baseline (that is, they had not had any treatment in the previous six months). In these and subsequent validation analyses, we used the squared multiple correlation between the predicted values and the observed values in the validation sample as the cross-validation R 2 . We developed the DPI final scoring weights by pooling the developmental and validation samples, as suggested by Kleinbaum and colleagues ( 58 ), and by calculating regression coefficients for the DPI variables across the pooled sample.
To assess whether theoretically important variables had been eliminated by chance during our scale development, we tested whether variables previously identified as prognostic in the literature but eliminated from the DPI during our testing process added to model R 2 values. Tested variables included the SF-36 mental and physical health composite scores; suicide attempt, plan, or ideation; probable prior depression; recent panic attack; quantity and frequency of alcohol consumption; work status; and number of chronic diseases.
To test the influence of study interventions on the composition of the DPI, we redeveloped index weights from unstandardized regression coefficients using the control group alone as our sample. We evaluated how these new predicted scores correlated with scores generated by the existing DPI.
Finally, we tested the clinical meaning of the DPI by rank-ordering patients according to their baseline DPI scores. We grouped them into quartiles from best to worst prognosis. We then calculated the percentage of patients within each quartile who actually experienced persistent major depression six months later. To maximize patient diversity for testing, we added the 321 patients with subthreshold depression for a total sample of 1,792.
Missing data. Data were weighted for the probability of enrollment and attrition at each step of enrollment and each survey wave by using SAS. We used multiple imputation (that is, we generated five randomly imputed data sets) to generate values for some missing items ( 59 , 60 , 61 , 62 ) using an extended hot deck technique that modifies the predictive mean matching method. The final analysis results are summarized across the five imputed data sets by using multiple imputation inference methods: the point estimates are averaged across the five imputed data sets, and the standard errors within the imputed data sets are combined with the variation of the point estimates across the five imputed data sets to form standard errors that reflect both within-imputation variability and between-imputation variability ( 61 , 63 ). We carried out all initial analyses on the first data set and retested in each of the four remaining data sets. Final results were averaged across the imputed data sets, correcting for clustering at the provider practice level ( 58 , 64 ).
Alternate DPI. To test the extent to which variable selection was conditioned by inclusion of our baseline depression symptom severity scale (mCESD), we conducted all of the development and validation steps above excluding this variable from the data set. We labeled the resulting index the Alternate DPI. Because initial runs showed the importance of anxiety variables, and only three of the four QID surveys fully matched on anxiety items, we calculated the final Alternate DPI for the 828 patients with major depression from the three studies with common anxiety variables and tested it for predicting persistent depression among the 978 patients with major or subthreshold depression from these studies.
Results
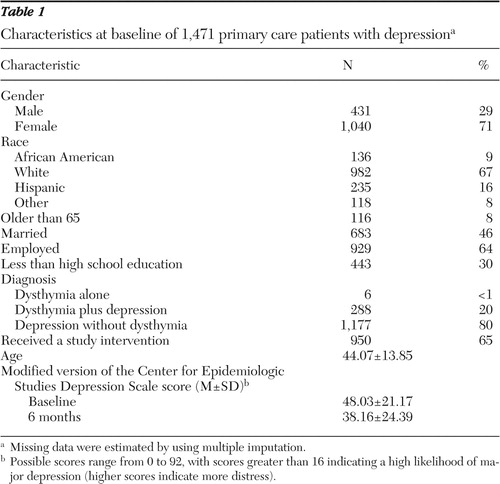
Baseline characteristics of our patient population (N=1,471) are shown in Table 1 . Men accounted for about one-third of the sample (29%). A third were members of a minority group (33%). Thirty percent had less than a high school education, and 36% were unemployed. Eight percent were over 65 years old.
 |
Univariate analyses within our five domains (for example, social health) conducted using our test sample yielded 55 variables that were assessed at baseline and significantly associated (p<.02) with depressive symptoms as measured by the mCESD six months later. In multivariate analyses that combined the significant variables from each domain, 24 variables remained independently predictive at a p value of less than .15, generating a model R 2 of .40. After variables (anger or irritability, time to the nearest hospital, and number of physical symptoms common among people with depression) that contributed minimal partial R 2 values (less than .012) were eliminated, the total R 2 for the final DPI was .33 with the test sample. The average R 2 on the validation sample (two-thirds of the sample) was .26 for both the final DPI and Alternate DPI across the five imputed data sets.
Final validation R 2 values for the DPI and Alternate DPI were all above our standard of greater than 20% for considering the index to be potentially useful, ranging from .26 to .27 across the five imputed data sets and averaging .27 ( Table 2 ). Table 2 also displays the coefficients for the DPI and Alternate DPI predictor variables. The sample includes all 1,471 patients with major depression (DPI) and all 828 patients with major depression from the three studies that administered the same anxiety battery (Alternate DPI). Final DPI predictors were score on the mCESD, severity of physical symptoms common among people with depression, social support, number of depression symptoms lasting two or more years, and receipt of an appropriate antidepressant for three or more months during the past six months. Final Alternate DPI predictors included all DPI predictors (other than the excluded mCESD) as well as anxiety symptom severity and the perception that health interfered with social activities.
 |
The R 2 values for nine additional validation analyses (for example, for the control group alone, experimental group alone, each study separately, excluding patients with very low depression severity, and excluding patients who initiated treatment after baseline) ranged from .21 to .42, with an average of .28. Validation results for the Alternate DPI (with the mCESD excluded as a predictor) were similar.
Adding variables to the DPI that had been eliminated during model development but were important predictors in the literature did not add significantly to the DPI's predictive power. Recalculating a predictive index using the control group alone showed correlations ranging from .94 to .95 across imputed data sets between the control group-derived index and the DPI.
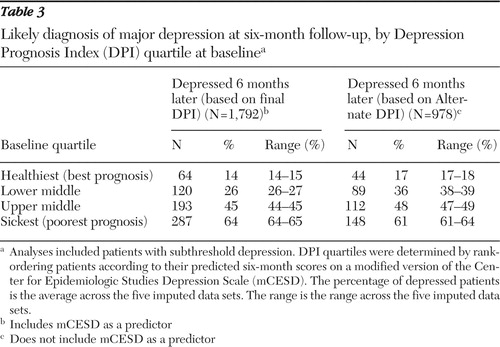
Table 3 shows the percentage of patients within each DPI and Alternate DPI quartile who had persistent depression at the six-month follow-up. Fourteen percent to 15% of patients (across imputed data sets) identified by the DPI as having the best prognosis at baseline (with DPI scores in the best-prognosis quartile of the study population) had a likely diagnosis of persistent major depression six months later. This contrasts with 64%–65% of patients identified by the DPI as being in the worst-prognosis quartile. The logistic regression equations used in these analyses passed the Hosmer and Lemeshow ( 65 ) goodness-of-fit test. Unimputed data gave virtually identical results.
 |
Discussion
We tested the feasibility and accuracy of predicting recovery from depression over a six-month period using a prognostic indicator based on patient self-reported characteristics at baseline. We found that levels of prediction yielded by our indicator were in the range considered useful in similar analyses for general medical problems such as congestive heart failure ( 9 ). Had we found no reliable prediction, considering the thoroughness with which our underlying set of variables represented previous research on characteristics associated with worse depression outcomes, we would have concluded that further development and validation of depression outcomes prediction tools based on current knowledge was unlikely to be fruitful. Instead, our findings indicate that the DPI achieved a useful level of prediction and that further research on depression prognostic indices is warranted.
Our findings are conservative both in terms of the diversity and representativeness of the sample we analyzed and in terms of the cross-validation strategy we used to gauge our final prediction levels. In an era of increasing attention to the benefits of tailoring care based on individual characteristics ( 24 , 66 ), prognostic measures are likely to increase in importance in both clinical and research settings. Research methodologists recommend inclusion of prognostic indices in treatment studies as a standard practice for reducing effects of unobserved sickness bias ( 10 ), and clinical settings have successfully used such indices as the basis for shorter decision tools ( 16 ), among other uses. Clinical managers can benefit from knowing who is at risk ( 15 , 19 , 66 ), and clinical intervention developers can develop strategies for achieving better results among difficult-to-treat groups ( 24 ).
Medical research on outcome prediction tools began two decades ago. The best known of these indices yielded levels of prediction within the general range we found for the DPI reported in this article. The Charlson Index ( 21 ), used for predicting death resulting from comorbid conditions, is extensively used in research ( 18 ) and has been validated for either medical record review or patient self-report ( 67 , 68 ). The Charlson Index classified patients into four groups with one-year mortality rates ranging from 12% to 85% on the basis of an initial development sample and from 8% to 59% in a validation sample. A widely used pneumonia prognostic index categorized patients into prognostic groups with mortality rates that ranged from 1% for the healthiest group to 37% for the sickest group ( 12 ). MedisGroups, a commercial prediction instrument, produced R 2 values ranging from .09 to .33 across six conditions when added to diagnosis-related group class for predicting hospital charges ( 15 ) but only .01 to .16 for predicting death at 30 days after admission ( 69 ). The authors considered the latter R 2 values for predicting death to be "modestly predictive." The R 2 for the APACHE III prediction instrument, which uses prospectively gathered laboratory values, history, and clinical examination findings to predict risk of death in the hospital on the basis of admission values, was .41 in a validation sample, considered an outstanding level of prediction ( 19 ).
Studies such as those described above show decreases in predictive ability between development samples and validation samples ( 69 , 70 , 71 ). In our study, the R 2 of .40 in our development sample dropped to an R 2 of .27 in our validation sample. The final R 2 , however, should remain stable in new populations. We expect stability also because of the diversity and representativeness of our patient and practice samples ( 31 ). The 108 practices in the sample were not only geographically dispersed but represented a variety of practice models, including staff model managed care, network model managed care, and small independent family practices. The practices also varied in quality of care for depression, in part because of the experimental interventions experienced by some of them. However, the index performed as well in the experimental and in the usual care group, and the final DPI scoring weights remained virtually identical when rederived through analysis of the control group alone.
Because we systematically identified variables within clinically important domains, minimizing collinearity effects, our results are meaningful in identifying clinically important prognostic factors. For example, in our sample, social support, the presence of a greater number of common physical symptoms, and major depression at sample entry despite three or more months of antidepressant treatment were more important in determining depression outcomes than were other commonly cited factors, such as race or ethnicity, socioeconomic background, age, chronic disease load, or suicidality.
We expected that depression symptom severity at baseline, as represented by the baseline mCESD, would be a strong predictor of depression symptom severity six months later. Interestingly, we found that the Alternate DPI and the DPI had equivalent predictive power (R 2 =.27). Alternate DPI calculations exchanged baseline mCESD for a measure of anxiety and a measure of the degree to which health interferes with social activities and retained all other DPI variables.
Our study has limitations. Causality cannot be tested with our observational design. Although our sample was diverse, it included only patients with access to primary care. Also, although we identified only a few factors as important to prediction, the full index is lengthy, including about 60 individual items contributing to four to six validated scales. Some variables identified as outcome predictors in the literature were missing from our database—in particular, smoking, exercise levels, and symptoms of posttraumatic stress disorder. The QID studies used few exclusion criteria; however, the exclusion of patients with pregnancy or very heavy drinking (greater than six drinks a day) should be noted. Researchers who collect data for calculating the DPI can include additional predictors along with the DPI in regression models and test for changes in results. Additional research will be required, however, to learn which additional variables warrant inclusion in future depression prediction indices.
Conclusions
Our analyses demonstrate the validity of the DPI and provide a basis for future research on and development of depression prognostic indices. Our results also challenge clinicians and researchers to learn more about the effects, reversibility, and mechanisms of action of clinical variables, such as social support and physical symptoms, included in the DPI. Final DPI variables predicted outcomes better than did ethnicity, income, or education and should be accounted for in future research on disparities. Recognition of the importance of DPI variables should also stimulate the development and testing of interventions designed to reduce their impact. Finally, DPI analyses facilitate development of shorter measures for clinical use by identifying a few critical clinical domains from among the many in the literature. As surveys become an ever more important tool in routine clinical practice, we expect that prognostic measures such as the DPI will be increasingly incorporated into both research and clinical activities.
Acknowledgments and disclosures
The research for this report was sponsored by grants R01-MH-64658, P50-MH-54623, R01-MH-54444, and MH-63651 from the National Institute of Mental Health; grant R01-HS-08349 from the Agency for Healthcare Research and Quality; grant 96-42901-A-HE from the John D. and Catherine T. MacArthur Foundation; and grant LIP-65-030 from the Department of Veterans Affairs (VA) Health Services Research and Development Center of Excellence for the Study of Healthcare Provider Behavior. The authors thank Scot Hickey, M.A., Bernadette Benjamin, M.A., Carl Elliot, M.S., Hong Vu, M.H.S., and Jose Arbelaez, M.D., Ph.D., for expert programming; Jeff Smith, B.S., Christy Klein, B.A., Maureen Carney, M.A., Chantal Avila, M.A., Carole Oken, M.A., Christine Nelson, B.A., Ray Turner, M.D., M.P.H., and Tracey Hare, B.A., for data collection and data management; Kathryn Magruder, Ph.D., and Paul Nutting, M.D., M.S.P.H., for work on the overall collaborations; and Bob Bell, Ph.D., for statistical consultation. The authors also thank the organizations participating in the studies, including Kaiser Permanente Medical Care Programs in the Northern California Region, Oakland; Department of Veterans Affairs Greater Los Angeles; Ambulatory Sentinel Practice Network, Denver; NYLCare Health Plans of the Mid-Atlantic, Greenbelt, Maryland; Allina Medical Group, Twin Cities, Minnesota; Columbia Medical Plan, Columbia, Maryland; Humana Health Care Plans, San Antonio, Texas; MedPartners, Los Angeles; PacifiCare of Texas, San Antonio; Valley-Wide Health Services, Alamosa, Colorado; Patuxent Medical Group, Patuxent, Maryland; and their associated behavioral health organizations, including Alamo Mental Health Group, San Antonio; San Luis Valley Mental Health/Colorado Health Networks; and Magellan/GreenSpring Behavioral Health, Columbia, Maryland. The authors are also grateful to the clinicians and patients who contributed their time and efforts.
The authors report no competing interests.
1. Broadhead WE, Blazer DG, George LK, et al: Depression, disability days, and days lost from work in a prospective epidemiologic survey. JAMA 264:2524–2548, 1990Google Scholar
2. Hirschfeld RMA, Montgomery SA, Keller MB, et al: Social functioning in depression: a review. Journal of Clinical Psychiatry 61:268–275, 2000Google Scholar
3. Mintz J, Mintz LI, Arruda MJ, et al: Treatments of depression and the functional capacity to work. Archives of General Psychiatry 49:761–768, 1992Google Scholar
4. Wells KB, Stewart A, Hays RD, et al: The functioning and well-being of depressed patients: results from the Medical Outcomes Study. JAMA 262:914–919, 1989Google Scholar
5. Zung WW, Broadhead WE, Roth ME: Prevalence of depressive symptoms in primary care. Journal of Family Practice 37:337–344, 1993Google Scholar
6. Katon W, Von Korff M, Lin E, et al: Collaborative management to achieve treatment guidelines: impact on depression in primary care. JAMA 273:1026–1031, 1995Google Scholar
7. Rost K, Nutting P, Smith J, et al: Improving depression outcomes in community primary care practice: a randomized trial of the quEST intervention: Quality Enhancement by Strategic Teaming. Journal of General Internal Medicine 16:143–149, 2001Google Scholar
8. Wells KB, Sherbourne C, Schoenbaum M, et al: Impact of disseminating quality improvement for depression in managed primary care: a randomized controlled trial. JAMA 283:212–220, 2000Google Scholar
9. Keeler EB, Kahn KL, Draper D, et al: Changes in sickness at admission following the introduction of the prospective payment system. JAMA 264:1962–1968, 1990Google Scholar
10. Hayward RA, Kent DM, Vijan S, et al: Reporting clinical trial results to inform providers, payers, and consumers. Health Affairs 24:1571–1581, 2005Google Scholar
11. Selker HP, Beshansky JR, Griffith JL, et al: Use of the acute cardiac ischemia time-insensitive predictive instrument (ACI-TIPI) to assist with triage of patients with chest pain or other symptoms suggestive of acute cardiac ischemia: a multicenter, controlled trial. Annals of Internal Medicine 129:845–855, 1998Google Scholar
12. Fine MJ, Singer DE, Hanusa BH, et al: Validation of a pneumonia prognostic index using the MedisGroups Comparative Hospital Database. American Journal of Medicine 94:153–159, 1993Google Scholar
13. Pozen MW, D'Agostino RB, Selker HP, et al: A predictive instrument to improve coronary-care-unit admission practices in acute ischemic heart disease: a prospective multicenter clinical trial. New England Journal of Medicine 310:1273–1278, 1984Google Scholar
14. Selker HPR, Schmid JH, Laks CH, et al: Time-dependent predictors of primary cardiac arrest in patients with acute myocardial infarction. American Journal of Cardiology 91:280–286, 2003Google Scholar
15. Iezzoni LI, Ash AS, Coffman GA, et al: Admission and mid-stay MedisGroups scores as predictors of hospitalization charges. Medical Care 29:210–220, 1991Google Scholar
16. Fine MJ, Auble TE, Yealy DM, et al: A prediction rule to identify low-risk patients with community-acquired pneumonia. New England Journal of Medicine 336:243–250, 1997Google Scholar
17. Ewig S, Kleinfeld T, Bauer T, et al: Comparative validation of prognostic rules for community-acquired pneumonia in an elderly population. European Respiratory Journal 14:370–375, 1999Google Scholar
18. Needham DM, Scales DC, Laupacis A, et al: A systematic review of the Charlson comorbidity index using Canadian administrative databases: a perspective on risk adjustment in critical care research. Journal of Critical Care 20:12–19, 2005Google Scholar
19. Knaus WA, Wagner DP, Draper EA, et al: The APACHE III prognostic system: risk prediction of hospital mortality for critically ill hospitalized adults. Chest 100:1619–1636, 1991Google Scholar
20. Horn SD, Sharkey PD, Buckle JM, et al: The relationship between severity of illness and hospital length of stay and mortality. Medical Care 29:305–317, 1991Google Scholar
21. Charlson ME, Pompei P, Ales KL, et al: A new method of classifying prognostic comorbidity in longitudinal studies: development and validation. Journal of Chronic Diseases 40:373–383, 1987Google Scholar
22. Geraci JM, Johnson ML, Gordon HS, et al: Mortality after cardiac bypass surgery: prediction from administrative versus clinical data. Medical Care 43:149–158, 2005Google Scholar
23. Gordon HS, Johnson ML, Wray NP, et al: Mortality after noncardiac surgery: prediction from administrative versus clinical data. Medical Care 43:159–167, 2005Google Scholar
24. Andreasen AR: Marketing Social Change: Changing Behavior to Promote Health, Social Development, and the Environment. San Francisco, Jossey-Bass, 1995Google Scholar
25. Unützer J, Katon W, Callahan CM, et al: Collaborative care management of late-life depression in the primary care setting: a randomized controlled trial. JAMA 288:2836–2845, 2002Google Scholar
26. Dietrich AJ, Oxman TE, Williams JW Jr, et al: Re-engineering systems for the treatment of depression in primary care: cluster randomized controlled trial. British Medical Journal 329:602, 2004Google Scholar
27. Sherbourne C, Schoenbaum M, Wells KB, et al: Characteristics, treatment patterns, and outcomes of persistent depression despite treatment in primary care. General Hospital Psychiatry 26:106–114, 2004Google Scholar
28. Rosenbaum JF, Fava M, Nierenberg AA, et al: Treatment-resistant mood disorder in treatment of psychiatric disorders, in Treatments of Psychiatric Disorders. Edited by Gabbard GO. Washington, DC, American Psychiatric Press, 2001Google Scholar
29. Rost K, Zhang M, Fortney J, et al: Persistently poor outcomes of undetected major depression in primary care. General Hospital Psychiatry 20:12–20, 1998Google Scholar
30. Rayburn NR, Rubenstein LV, Sherbourne CD, et al: Predicting Six Month Depression Outcomes for Primary Care Patients With Major Depression: Development and Performance of a Depression Prognosis Index. Santa Monica, Calif, RAND Corp, RAND Health, in pressGoogle Scholar
31. Rost KM, Duan N, Rubenstein LV, et al: The Quality Improvement for Depression collaboration: general analytic strategies for a coordinated study of quality improvement in depression care. General Hospital Psychiatry 23:239–253, 2001Google Scholar
32. Composite International Diagnostic Interview (CIDI). Geneva, World Health Organization, 1997Google Scholar
33. Orlando M, Meredith LS: Understanding the causal relationship between patient-reported interpersonal and technical quality of care for depression. Medical Care 40:696–704, 2002Google Scholar
34. Radloff LS: The CES-D Scale: a self-report depression scale for research in the general population. Applied Psychological Measurement 1:385–401, 1977Google Scholar
35. Sherbourne CD, Wells KB, Duan N, et al: Long-term effectiveness of disseminating quality improvement for depression in primary care. Archives of General Psychiatry 58:696–703, 2001Google Scholar
36. Ware JE, Kosinski M, Keller SD: A 12-Item Short-Form Health Survey: construction of scales and preliminary tests of reliability and validity. Medical Care 34:220–233, 1996Google Scholar
37. Orlando M, Sherbourne CD, Thissen D: Summed-score linking using item response theory: application to depression measurement. Psychological Assessment 12:354–359, 2000Google Scholar
38. Akiskal HS: Factors associated with incomplete recovery in primary depressive illness. Journal of Clinical Psychiatry 43:266–271, 1982Google Scholar
39. Gonzales LR, Lewinsohn PM, Clarke GN: Longitudinal follow-up of unipolar depressives: an investigation of predictors of relapse. Journal of Consulting and Clinical Psychology 53:461–469, 1985Google Scholar
40. Swindle RW, Cronkite RC, Moos RH: Life stressors, social resources, coping, and the 4-year course of unipolar depression. Journal of Abnormal Psychology 98:468–477, 1989Google Scholar
41. Brent DA, Kolko DJ, Birmaher B, et al: Predictors of treatment efficacy in a clinical trial of three psychosocial treatments for adolescent depression. Journal of the American Academy of Child and Adolescent Psychiatry 37:906–914, 1998Google Scholar
42. Krantz SE, Moos RH: Risk factors at intake predict nonremission among depressed patients. Journal of Consulting and Clinical Psychology 56:863–869, 1988Google Scholar
43. Brown GW, Harris TO, Hepworth C, et al: Clinical and psychosocial origins of chronic depressive episodes: II. a patient enquiry. British Journal of Psychiatry 165:457–465, 1994Google Scholar
44. Sherbourne CD, Hays RD, Wells KB: Personal and psychosocial risk factors for physical and mental health outcomes and course of depression among depressed patients. Journal of Consulting and Clinical Psychology 63:345–355, 1995Google Scholar
45. Billings AG, Moos RH: Psychosocial processes of remission in unipolar depression: comparing depressed patients with matched community controls. Journal of Consulting and Clinical Psychology 53:314–325, 1985Google Scholar
46. Lin E, Parikh SV: Sociodemographic, clinical, and attitudinal characteristics of the untreated depressed in Ontario. Journal of Affective Disorders 53:153–162, 1999Google Scholar
47. Miranda J, Cooper LA: Disparities in care for depression among primary care patients. Journal of General Internal Medicine 19:120–126, 2004Google Scholar
48. Unützer J, Katon W, Callahan CM, et al: Depression treatment in a sample of 1,801 depressed older adults in primary care. Journal of the American Geriatrics Society 51:505–514, 2003Google Scholar
49. Ware JE, Kosinski M, Keller SD: SF-36 Physical and Mental Health Summary Scales: A User's Manual. Boston, Health Institute, New England Medical Center, 1994Google Scholar
50. Stewart AL, Ware JE: Measuring Functioning and Well-Being: The Medical Outcomes Study Approach. Durham, NC, Duke University Press, 1992Google Scholar
51. Rost K, Burnam MA, Smith GR: Development of screeners for depressive disorders and substance disorder history. Medical Care 31:189–200, 1993Google Scholar
52. Schoenbaum M, Unützer J, McCaffrey D, et al: The effects of primary care depression treatment on patients' clinical status and employment. Health Services Research 37:1145–1158, 2002Google Scholar
53. Sherbourne CD, Stewart AL: The MOS Social Support Survey. Social Science and Medicine 32:705–714, 1991Google Scholar
54. Sherbourne CD, Meredith LS, Rogers W, et al: Social support and stressful life events: age differences in their effects on health-related quality of life among the chronically ill. Quality of Life Research 1:235–246, 1992Google Scholar
55. Stewart AL, Hays RD, Ware JE: Methods of validating MOS health measures, in Measuring Functioning and Well-Being: The Medical Outcomes Study Approach. Edited by Stewart AL, Ware JE. Durham, NC, Duke University Press, 1992Google Scholar
56. Unützer J, Rubenstein L, Katon WJ, et al: Two-year effects of quality improvement programs on medication management for depression. Archives of General Psychiatry 58:935–942, 2001Google Scholar
57. Jaycox LH, Miranda J, Meredith LS, et al: Impact of a primary care quality improvement intervention on use of psychotherapy for depression. Mental Health Services Research 5:109–120, 2003Google Scholar
58. Kleinbaum DG, Kupper LL, Muller KE: Applied Regression Analysis and Other Multivariable Methods. Belmont, Calif, Duxbury Press, 1988Google Scholar
59. SAS 9.1.3 for Windows. Cary, NC, SAS Institute, Inc, 2002Google Scholar
60. Little RJA: Pattern-mixture models for multivariate incomplete data. Journal of the American Statistical Association 88:125–134, 1993Google Scholar
61. Little RJA, Rubin DB: Statistical Analysis With Missing Data. New York, Wiley, 1987Google Scholar
62. Schafer JL: Analysis of Incomplete Multivariate Data. New York, Wiley, 1997Google Scholar
63. Rubin DB: Multiple Imputation for Nonresponse in Surveys. New York, Wiley, 1987Google Scholar
64. Bell R, McCaffrey D: Bias reduction in standard errors for linear regression with multi-stage samples. Survey Methodology 28:169–179, 2002Google Scholar
65. Hosmer DW, Lemeshow S: Applied Logistic Regression. New York, Wiley, 1989Google Scholar
66. Herridge MS: Prognostication and intensive care unit outcome: the evolving role of scoring systems. Clinics in Chest Medicine 24:751–762, 2003Google Scholar
67. McGregor JC, Kim PW, Perencevich EN, et al: Utility of the Chronic Disease Score and Charlson Comorbidity Index as comorbidity measures for use in epidemiologic studies of antibiotic-resistant organisms. American Journal of Epidemiology 161:483–493, 2005Google Scholar
68. Chaudhry S, Jin L, Meltzer D: Use of a self-report-generated Charlson Comorbidity Index for predicting mortality. Medical Care 43:607–615, 2005Google Scholar
69. Iezzoni LI, Ash AS, Coffman GA, et al: Admission and mid-stay MedisGroups scores as predictors of death within 30 days of hospital admission. American Journal of Public Health 81:74–78, 1991Google Scholar
70. Charlson ME, Ales KL, Simon R, et al: Why predictive indexes perform less well in validation studies: is it magic or methods? Archives of Internal Medicine 147:2155–2161, 1987Google Scholar
71. Daley J: Validity of risk adjustment methods, in Risk Adjustment for Measuring Health Care Outcomes. Edited by Iezzoni LI. Ann Arbor, Mich, Health Administration Press, 1994Google Scholar