Mental Health Treatment Expenditure Trends, 1986–2003
Mental health treatment is delivered in many forms, including prescription drugs, medication management, psychotherapy, rehabilitation counseling, inpatient stays, and residential care. It is delivered by a wide variety of professionals, including psychiatrists, general medical doctors, nurses, psychologists, and social workers, in a broad array of settings—offices, clinics, hospitals, and nursing homes. Funding sources for care are diverse. They include federal, state, and local governments as well as private insurance and self-payments.
In recognition of the value of calculating spending on mental health treatment in the United States, the Substance Abuse and Mental Health Services Administration (SAMHSA) has been directing the development of estimates of mental health treatment expenditures on a regular basis over the past ten years. Spending figures have been published periodically and typically describe trends over a ten-year time span ( 1 , 2 , 3 ). Total mental health expenditures are presented, as well as expenditures by payer type, provider type, and type of setting and service. Expenditures are compared with all health care spending, thus allowing one to track changes in mental health expenditures relative to all health care, as well as to determine what proportion of total health care dollars are allocated to mental health services.
In this article, we present the latest estimates of spending as well as an analysis of long-term trends from 1986 to 2003 in order to increase understanding of the evolution of spending for mental health treatment over much of the past two decades by provider type, setting, and payer.
Methods
The approach taken to estimate national mental health spending is designed to be consistent with the National Health Expenditure Accounts (NHEA). The NHEA constitute the framework from which the estimates of spending for all health care are constructed by the Centers for Medicare and Medicaid Services.
Two basic methods are used to estimate mental health treatment expenditures, depending on provider or service type. The first method relies on SAMHSA's national surveys of specialty mental health and substance abuse organizations. The Survey of Mental Health Organizations (SMHO), formerly called the Inventory of Mental Health Organizations, and the National Survey of Substance Abuse Treatment Services (N-SSATS), formerly referred to as the Uniform Facilities Data Set, cover services provided by specialty psychiatric and substance abuse hospitals, specialty psychiatric and substance abuse units in general hospitals, multiservice mental health organizations, and specialty substance abuse centers. Surveys are not available for some of the 1986–2003 years. Missing years of data were therefore projected or imputed on the basis of facility characteristics, such as size, geographic location, and ownership (details of the imputation methods are available from the author).
The second method carves out spending on mental health from the NHEA. Services and providers not fully covered in the N-SSATS or SMHO but covered in the NHEA include general hospitals (excluding psychiatric specialty units), physicians, other professionals (such as social workers, psychologists, and nurses), retail prescription drugs, nursing homes, and home health agencies. Estimates for these services are based on NHEA estimates of total spending by provider and payer. The proportion of total spending allocated to mental health is estimated with public-use, nationally representative, provider-based data collections, such as the National Ambulatory Medical Care Survey and the Nationwide Inpatient Sample (NIS) Healthcare Cost and Utilization Project. Estimates of allocations to mental health generally involve first determining the proportion of total service utilization (for example, inpatient days) that is associated with a primary mental health diagnosis, then adjusting for differences in average charges and cost sharing between mental health and all health. In most cases, the provider-based surveys identify only the primary expected source of payment. To identify the secondary payers, the Medical Expenditure Panel Survey (MEPS) is used to determine the share paid by the primary payer and the share paid by every other payer across all the provider types. The two methods—the NHEA method and the SAMHSA method—are integrated by adding up expenditures by provider and payer after accounting for duplication across data sources.
To define mental health disorders, we relied on diagnostic codes found in the International Classification of Diseases, 9th Revision ( ICD-9-CM ) for "mental disorders" (codes in sections 290 through 319). We excluded from these codes diagnoses related to substance dependence and addiction (including tobacco) (codes 291, 292, and 303–305), developmental delays (code 315), and psychic factors associated with disease classified elsewhere (code 316). We included pregnancy complications mainly related to mental disorders (code 648.4) but excluded "cerebral degenerations" (for example, Alzheimer's disease, code 331.0) and several other codes related to dementia, as well as mental retardation. The allocation to mental health is based on principal or primary diagnoses. [A full list of diagnosis codes is available in an online supplement to this article at ps.psychiatryonline.org.]
The diagnostic categories selected generally reflect what payers consider to be mental health conditions. They exclude costs not directly related to treatment, such as disability-related costs. They also exclude expenditures for conditions that are neither mental health nor substance abuse conditions but that are caused by mental health and substance abuse problems, such as complications from intentional injuries.
Prescription drug expenditures are considered to be a form of mental health treatment if the medication's primary indication is for a mental health disorder. More detailed information on the methods employed can be found elsewhere ( 4 ).
Results
Mental health spending versus all health, 1986–2003
As shown in Table 1 , mental health treatment expenditures in the United States grew from $33 billion in 1986 to $100 billion in 2003. In 2003 dollars adjusted for inflation by using the gross domestic product deflator, spending per capita on U.S. mental health treatment rose from $205 to $345.
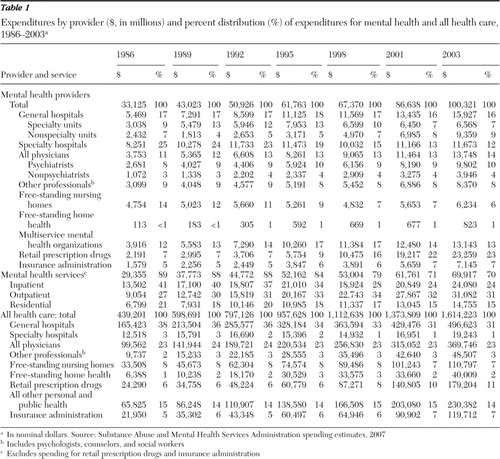 |
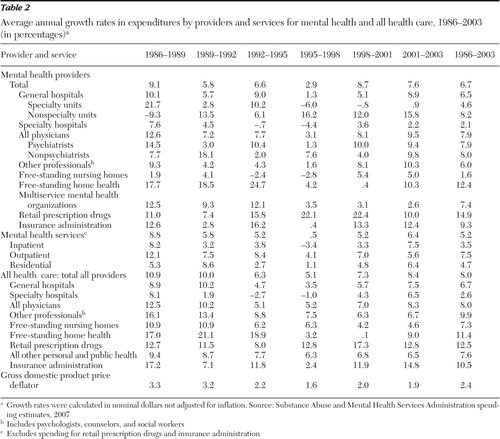
Table 2 shows the average annual nominal mental health expenditure growth rate (6.7%) and the growth rate of total health care expenditures (8.0%). Growth in mental health expenditures was below growth in all health expenditures for most years of the study period. As a result of the slower growth rate of mental health, mental health expenditures fell from 8% of all health expenditures in 1986 to 6% of all health expenditures in 2003 (data not shown). Total health spending increased by approximately $1.175 trillion from 1986 to 2003; of this amount, 6% could be attributed to an increase in mental health spending (calculated from data in Table 1 ).
 |
Trends in services
There was a large shift over the time period away from expenditures on inpatient mental health treatment and toward retail psychoactive prescription drugs. From 1986 to 2003 inpatient spending on mental health treatment fell from 41% of total mental health expenditures to 24%, and retail psychoactive prescription drug expenditures grew from 7% to 23% ( Table 1 ).
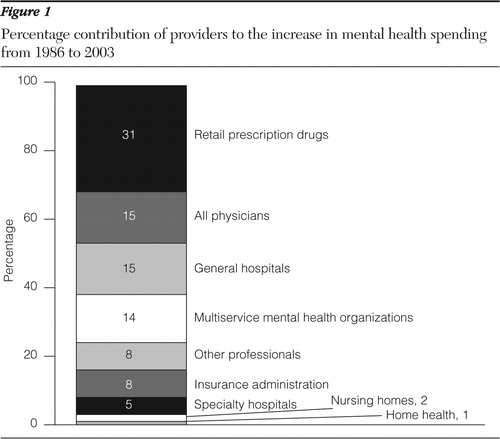
As Figure 1 shows, prescription drug spending contributed 31% to the total change in mental health expenditures from 1986 to 2003. Outpatient expenditures contributed 33%; inpatient expenditures, 16%; and residential expenditures, 12% (data not shown). The proportion of spending increases attributed to each service was determined by calculating the total spending increase of each service type from 1986 to 2003 and dividing by the total mental health spending increase from 1986 to 2003.
Spending for mental health medications grew more rapidly than spending for all medications combined (14.9% on average annually, compared with 12.5% overall) ( Table 2 ). As a result, mental health medication expenditures increased as a share of all retail prescription medication expenditures, rising from 9% to 13% (data not shown). The growth in expenditures for psychoactive prescription drugs was particularly rapid through the latter half of the 1990s ( Table 2 ). From 1996 to 2000 pharmaceutical expenditures grew by more than 20% each year. Around this period, a number of new antidepressants and antipsychotic medications came on the market (for example, olanzapine, 1996; mirtazapine, 1996; quetiapine fumarate, 1997; venlafaxine, 1997; and citalopram, 1998) and existing medications were used for new indications (for example, paroxetine for panic disorder and antipsychotics for mania) ( 5 ).
The latest three years of data suggest that mental health pharmaceutical spending growth may be moderating. From 2001 to 2003 spending on mental health drugs grew by an average of 10% annually, slightly slower than the average annual growth in spending for all medications ( Table 2 ).
Inpatient mental health treatment expenditures increased at an average annual rate of 3.5% from 1986 to 2003 ( Table 2 ). The lowest growth occurred from 1995 to 1998, when growth in inpatient expenditures was negative (average annual rate of -3.4%). This is the period when managed care is thought to have had its largest effects. Managed care plans achieved significant cost reductions primarily by limiting inpatient psychiatric utilization and negotiating lower prices.
Public and private payer trends
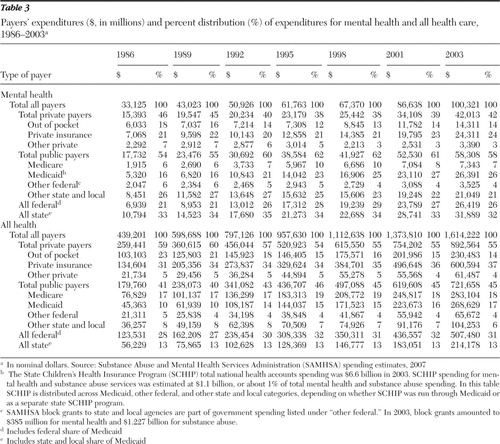
Overall, the mix in public and private mental health payers did not change much from 1986 to 2003. In the late 1980s through the mid-1990s, growth in public spending outpaced growth in private spending. This growth trend reversed from the mid-1990s to 2003. As shown in Table 3 , from 1986 to 1995 spending by all combined public payers grew from 54% of total mental health expenditures to 62%, then the public-payer share of mental health spending fell to 58% in 2003. Mental health spending grew more slowly than all health spending within most payer categories. As a result, mental health expenditures fell as a percentage of most of the major payers (calculated from data in the tables).
 |
Private insurance trends
Mental health private insurance expenditures as a percentage of all private insurance expenditures fell from 5.3% to 4.0% between 1986 and 2003 (calculated from data in the tables). Trends in mental health private insurance expenditures tracked trends in private insurance expenditure for all health care but at slightly slower growth rates. During the 1980s insurance payment for mental health was still largely on a fee-for-service basis and included some benefit restrictions on the intensity of care, such as limitations on inpatient days and outpatient visits and relatively high copayments. By the mid-1980s employers were reporting large increases in mental health expenditures ( 6 ). Although the SAMHSA spending estimates data do not cover the early 1980s, they reveal that from 1986 to 1989, private insurance expenditures on mental health grew rapidly (10.7% annually) but by less than private insurance expenditures on all health care (15.1% annually) ( Table 4 ).
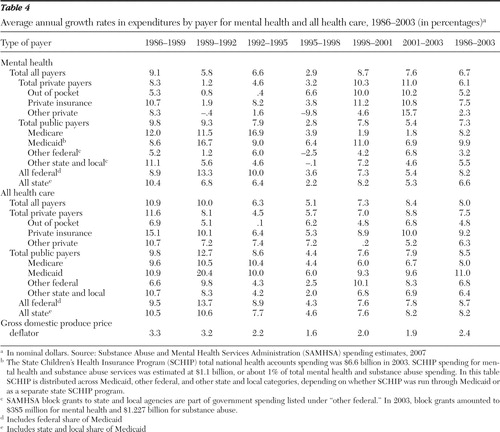 |
Employers responded to mental health cost concerns by enrolling employees in managed behavioral health plans. Partly as a result of these cost-containment efforts, growth in private insurance spending on mental health treatment was very slow in the early 1990s. For 1998–2003 mental health private insurance expenditures grew more rapidly, primarily because of increases in spending on mental health prescription drugs ( Table 4 ).
Out-of-pocket spending
From 1986 to 1995 out-of-pocket payments fell as a percentage of total mental health expenditures—from 18% to a low of 12%—and then grew to 14% of total mental health spending in 2003 ( Table 3 ). For all health expenditures, out-of-pocket payments fell from 23% in 1986 to 14% in 2003. The trend difference between mental health out-of-pocket spending and that for all health stems from the rapidly rising spending on prescription drugs (which are a larger share of mental health spending than of all health spending) and the increasing copayments required by insurers to control soaring drug costs. Trends in out-of-pocket payments are affected by cost-sharing levels for particular services, the mix of services, the mix of payers, and the number of uninsured individuals.
Medicaid
Among the payers for mental health treatment, Medicaid grew in importance, increasing from 16% of total mental health expenditures in 1986 to 26% in 2003 ( Table 3 ). In 1986 other spending by state and local governments was the largest source of payment for mental health care (26% of total mental health dollars) ( Table 3 ). By 2003 Medicaid had supplanted other state and local government payments as the single largest payer for mental health care ( Table 3 ).
From 1986 to 2003 Medicaid was the fastest-growing mental health payer, increasing at a 9.9% average annual rate ( Table 4 ). However, growth in Medicaid expenditures on all health care increased even faster, causing mental health Medicaid expenditures to fall from 12% of all Medicaid expenditures in 1986 to 10% in 2003 (calculated from data in Table 3 ).
Other public payers
Mental health spending remained a relatively constant share of all Medicare expenditures (2% to 3%) from 1986 to 2003 (calculated from data in the tables). As a share of other federal spending, which includes federal block grants, and spending by the Department of Veterans Affairs and Department of Defense, mental health expenditures fell from 10% to 5%. As a percentage of other state and local expenditures, mental health spending fell from 23% to 20%.
Provider trends
In total, mental health spending grew by $67 billion between 1986 and 2003 (in nominal dollars not adjusted for inflation). As Figure 1 shows, prescription psychoactive drug expenditures contributed the most to this increase (31%), followed by general hospitals (15%), physicians (15%), and multiservice mental health organizations (14%). The percentage contribution to the change in spending is a function of both the overall level that a provider contributes in the base year as well as the growth rate of spending over the period. This implies that a provider share that grew relatively slowly but made up a large portion of mental health expenditures in the base year may contribute more to overall mental health spending changes than one that grew rapidly but constituted a very small portion of the total at the start of the period.
Hospital care
As Table 1 shows there has been a general decline in the proportion of mental health expenditures directed toward hospitals, particularly specialty hospitals. Specialty hospital expenditures fell from 25% of total mental health expenditures in 1986 to only 12% in 2003.
Over this period psychiatric hospital spending experienced an average growth rate of 2.1% annually ( Table 2 ). According to data from Mental Health, United States, 2002, the number of inpatient admissions to private psychiatric hospitals rose from about 235,000 in 1986 to 529,000 in 2000, and the number of outpatient visits rose from 132,000 to 358,000 ( 7 ). In contrast, state and county psychiatric hospitals witnessed a continuous decline both in admissions (from 333,000 in 1986 to 218,000 in 2000) and in outpatient visits (from 68,000 to 55,000) ( 7 ).
Physicians and other independent professionals
The share of mental health spending going to physicians increased slightly, from 11% of total mental health expenditures in 1986 to 14% in 2003 ( Table 1 ). Expenditures for physician mental health treatment grew by 7.9% annually ( Table 2 ). Underlying this growth was a significant increase in the number of office visits to mental health physicians, from 26 million in 1986 to 40 million in 2002 (based on data from the National Ambulatory Medical Care Survey [www.cdc.gov/nchs]). Psychiatrist and other physician mental health expenditures both separately grew by about 8% annually between 1986 and 2003. In 2003 psychiatrists accounted for 10% of expenditures, whereas other physicians accounted for 4%.
Mental health spending for services provided by other independently practicing professionals, such as social workers, psychologists, and nurses, grew by about 6% annually ( Table 2 ). Other professionals made up 9% of total mental health expenditures in 1986 and 8% in 2003.
Nursing homes
Free-standing nursing homes constituted 14% of total mental health spending in 1986 and only 6% in 2003 ( Table 1 ). Mental health expenditures in nursing homes grew by 1.6% annually ( Table 2 ), falling in inflation-adjusted terms. This decline in expenditures is consistent with other analyses that have revealed that the number of residents in nursing homes with a primary diagnosis of mental illness has been declining, particularly among residents under age 65, those with severe mental illness, and those without comorbid physical illnesses ( 8 ). In this SAMHSA study, we defined nursing home expenditures on mental health on the basis of the primary diagnosis at the time the nursing home diagnosis was extracted from the patient's chart. In addition, we excluded spending on Alzheimer's disease and other dementias.
Multiservice mental health organizations
Multiservice mental health organizations are free-standing mental health specialty providers other than hospitals, such as clinics and residential centers. In 2003 a total of 13% of mental health dollars went to multiservice mental health organizations ( Table 1 ). Mental health spending at these facilities grew by 7.4% annually ( Table 2 ). From 1986 to 2000 the number of multiservice mental health organizations declined slightly, from about 2,600 to 2,500. However, the number of outpatient visits to these clinics increased by 35%, to more than 2.8 million visits in 2000 ( 7 ).
Discussion
This analysis found that in inflation-adjusted 2003 dollars, spending per capita on mental health treatment rose from $205 to $345 from 1986 to 2003, which raises the obvious question: what are we getting for our growing investment? The conclusion by multiple authors is that much of the growth in mental health expenditures reflects a significant increase in the number of people receiving treatment for mental illness ( 9 , 10 , 11 , 12 , 13 , 14 , 15 ). For example, in the National Comorbidity Survey Replication, Kessler and colleagues ( 13 ) found that among those with a serious mental disorder, the percentage receiving treatment rose from 24% in 1990–1992 to 41% in 2001 ( 13 ).
The increase in access has been driven in part by the growing use of pharmacotherapy, which was stimulated by improved insurance coverage for prescription drugs and the development of new psychoactive medications. This has also been accompanied by increases in outpatient treatment. Offsetting this increase has been a decline in inpatient and institutional care, such as that provided in nursing homes, psychiatric units of general hospitals, and psychiatric hospitals.
Although psychoactive medications have provided a relatively cost-effective method for people to obtain relief from their symptoms—and in many cases to achieve recovery—the increase in medication use and the volume of mental health treatment provided in general does not address the question of whether the treatment being provided is appropriate and meets quality guidelines ( 10 , 11 ). Some recent data suggest that access and quality concerns are still prevalent. For example, a recent SAMHSA survey found that 8.3 million adults reported having unmet needs for treatment for mental health problems in the past year; of these, nearly half reported that cost or insurance issues posed a barrier to receiving treatment ( 16 ). Since 1998 out-of-pocket spending on mental heath treatment has been growing at more than 10% a year, outpacing the growth rate of out-of-pocket spending for all health care, largely as a result of the growth in prescription drug use and prescription drug cost-sharing rates.
As more mental health care has shifted into communities and away from inpatient and institutional settings, the need for adequate monitoring and coordination across systems and time has grown. The National Committee for Quality Assurance reported that in this regard the quality of mental health care remained as poor in 2005 as it was several years before; many patients taking antidepressants still do not receive appropriate monitoring, and many individuals hospitalized for mental illness do not receive follow-up care ( 17 ). Analyses of MEPS data found that from 1996 to 2001 the percentage of persons who received psychotropic drugs in the absence of any ambulatory mental health visits during the year increased from 26% to 34% of psychotropic drug users ( 10 ). Contributing to the lack of monitoring may be the fact that more patients are receiving care from primary care physicians, who may not have adequate incentives to routinely schedule medication maintenance visits ( 18 , 19 ).
A second key finding from the SAMHSA analysis is that more of public mental health treatment is being funded by Medicaid and proportionately less by state budgets. As the report of the New Freedom Commission highlighted ( 20 ), increasingly, "most resources for people with serious mental illnesses (e.g., Medicaid) are not typically within the direct control or accountability of the administrator of the State mental health system. For example, depending on the State and how the budget is prepared, Medicaid may be administered by a separate agency with limited mental health expertise. Separate entities also administer criminal justice, housing, and education programs, contributing to fragmented services." In response to these identified issues, the New Freedom Commission recommended the development of a comprehensive state mental health plan that would create a partnership among federal, state, and local governments as well as consumers and families ( 20 ).
The SAMHSA spending estimates provide the only global view of mental health treatment spending. One must turn to other sources of data on disease epidemiology, treatment utilization, access, and quality to understand the likely drivers and consequences of the spending trends. These spending estimates also must be understood in light of their limitations. The estimates depend on the underlying data sources, which are subject to uncertainties in reporting as well as missing observations. For example, mental health treatment is identified often by coding from medical records, which may be inaccurate. Similarly, for prescription drugs the study assumed that all drugs with a primary psychiatric indication are used to treat psychiatric disorders. Because of the complex way in which multiple years of data from multiple sources are compiled, it is not possible to calculate an exact confidence interval around the spending estimates.
One way to gain confidence in the estimates is to compare them with other data sources. In addition to the NHEA, the other main source of data on national mental health spending and trends is the MEPS ( 9 , 10 , 11 ). In general, MEPS analyses have revealed trends similar to those presented here. MEPS has an advantage over the NHEA in that data are collected at the person level; thus spending trends can be parsed into trends in the percentage of the population using services, the intensity of use, and the price of services. Although MEPS data are useful for confirming trends, MEPS totals may diverge from the NHEA because MEPS underestimates hospital expenditures and expenditures on other large events, excludes institutionalized populations, and is based on self-reported diagnoses rather than provider-documented diagnoses ( 10 , 21 ).
Conclusions
This article presents estimates of mental health treatment expenditure for 1986 through 2003. This is the first time that these data have been presented as a series and that data from 2002 and 2003 have been described. We found that mental health expenditures have grown and changed dramatically in their composition over the past 17 years. Spending per capita has increased, and complementary data show that more people are now receiving mental health services. The mix of services has changed—more care is now provided through prescription drugs and in outpatient settings and less in inpatient settings. Payer mix has also shifted, with Medicaid taking a more prominent role. These changes raise new challenges for ensuring quality and access.
Acknowledgments and disclosures
This work was funded by a contract from the Substance Abuse and Mental Health Services Administration. The views expressed do not necessarily reflect the opinions of the Substance Abuse and Mental Health Services Administration or the Department of Health and Human Services.
The authors report no competing interests.
1. McKusick D, Mark TL, King E, et al: Spending for mental health and substance abuse treatment. Health Affairs 17(5):147–157, 1998Google Scholar
2. Mark TL, Coffey RM, King E, et al: Spending on mental health and substance abuse treatment, 1987–1997. Health Affairs 19 (4):108–120, 2000Google Scholar
3. Mark TL, Coffey RM, Vandivort-Warren R, et al: US spending for mental health and substance abuse treatment, 1991–2001. Health Affairs, Jan–June, 2005, suppl Web exclusives, pp W5-133–W5-142Google Scholar
4. Mark TL, Levit KR, Coffey RM, et al: National Expenditures for Mental Health Services and Substance Abuse Treatment, 1993–2003, DHHS pub no SMA 07-4227. Rockville, Md, Substance Abuse and Mental Health Services Administration, 2007Google Scholar
5. Lieberman JA, Golden R, Stroup S, et al: Drugs of the psychopharmacological revolution in clinical psychiatry. Psychiatric Services 51:1254–1258, 2000Google Scholar
6. Freudenheim M: Mental-health costs surge. New York Times, Dec 1, 1987Google Scholar
7. Manderscheid R, Atay JE, Male A, et al: Highlights of organized mental health services in 2000 and major national and state trends, in Mental Health, United States, 2002. Manderscheid RJ, Henderson M, eds. Rockville, Md, Substance Abuse and Mental Health Services Administration, 2002Google Scholar
8. Mechanic D, McAlpine DD: Use of nursing homes in the care of persons with severe mental illness: 1985 to 1995. Psychiatric Services 51:354–358, 2000Google Scholar
9. Thorpe KE, Florence CS, Joski P: Which medical conditions account for the rise in health care spending? Health Affairs, Jul–Dec 2004, suppl Web exclusives, W4-437-45Google Scholar
10. Zuvekas SH: Prescription drugs and the changing patterns of treatment for mental disorders, 1996–2001. Health Affairs 24:195–205, 2005Google Scholar
11. Zuvekas SH: Trends in mental health services use and spending, 1987–1996. Health Affairs 20(2):214–224, 2001Google Scholar
12. Druss BG: Rising mental health costs: what are we getting for our money? Health Affairs 25:614–622, 2006Google Scholar
13. Kessler RC, Demler O, Frank RG, et al: Prevalence and treatment of mental disorders, 1990 to 2003. New England Journal of Medicine 352:2515–2523, 2005Google Scholar
14. Mechanic D, Bilder S: Treatment of people with mental illness: a decade-long perspective. Health Affairs 23(4):84–95, 2004Google Scholar
15. Mojtabai R: Trends in contacts with mental health professionals and cost barriers to mental health care among adults with significant psychological distress in the United States: 1997–2002. American Journal of Public Health 9:2009–2014, 2005Google Scholar
16. Barker PR, Epstein JF, Hourani LL, et al: Patterns of Mental Health Service Utilization and Substance Use Among Adults, 2000 and 2001. DHHS pub no SMA 04–3901, analytic series A-22. Rockville, Md, Substance Abuse and Mental Health Services Administration, Office of Applied Studies, 2004Google Scholar
17. The State of Health Care Quality: Industry Trends and Analysis. Washington, DC, National Committee for Quality Assurance, 2006Google Scholar
18. Pirraglia PA, Stafford RS, Singer DE: Trends in prescribing of selective serotonin reuptake inhibitors and other newer antidepressant agents in adult primary care. Primary Care Companion to the Journal of Clinical Psychiatry 5:153–157, 2005Google Scholar
19. Harman JS, Crystal S, Walkup J, et al: Trends in elderly patients' office visits for the treatment of depression according to physician specialty: 1985–1999. Journal of Behavioral Health Services Research 30:332–341, 2003Google Scholar
20. Achieving the Promise: Transforming Mental Health Care in America. Pub no SMA-03-3832. Rockville, Md, Department of Health and Human Services, President's New Freedom Commission on Mental Health, 2003Google Scholar
21. Selden TM, Levit KR, Cohen JW, et al: Reconciling medical expenditure estimates from the MEPS and the NHA, 1996. Health Care Finance Review 23:161–178, 2001Google Scholar