Datapoints: Referrals to Psychiatrists
In May 1996 the American Psychiatric Association's office of research, in collaboration with the APA Practice Research Network, conducted the National Survey of Psychiatric Practice, a study of 970 APA members (a 71 percent response rate) designed to provide representative national data on important issues in psychiatry (1). This column examines the distribution of patient referrals per month across demographic and practice characteristics for responding psychiatrists who reported having received at least one patient referral during a typical month (N=860).
On average, the psychiatrists treated 39 patients per week and received 16 patient referrals per month. Comparisons by age groups, which serve as a proxy for the relative stages in a psychiatrist's professional career, showed that psychiatrists 39 years and younger had, on average, the greatest total number of referrals per month (N=20). Psychiatrists age 40 to 54 years had an average of 15 referrals, and those 55 years and older an average of 13.
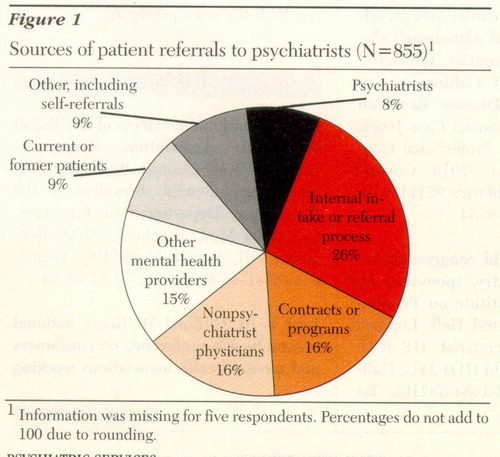
Figure 1 shows the percent distribution of patient referrals by referral source. More than two-fifths of the referrals were received through a combination of traditional sources, that is, through the internal intake process of the institutions with which the psychiatrist is affiliated and through managed care contracts or programs. Nonpsychiatrist physicians and other mental health professionals accounted for 16 percent and 15 percent of referrals, respectively, while current or former patients and other psychiatrists supplied fewer than 10 percent each.
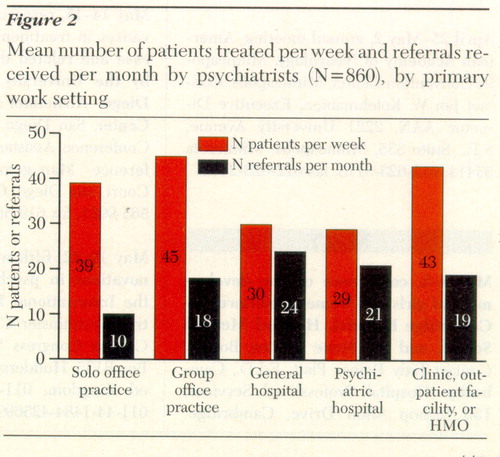
Figure 2 shows the number of patients treated per week and the number of patient referrals received per month by the psychiatrist's primary work setting. As expected, psychiatrists in inpatient settings with high patient turnover had the highest number of referrals. In outpatient settings, psychiatrists in group practice had almost twice the number of referrals as psychiatrists in solo office practice but treated an average of only 15 percent more patients per week. More detailed studies are needed to explain these differences.
Obtaining data on patient referral patterns is critical as the role of psychiatrists in the changing health care system continues to evolve. Future surveys of psychiatric practice will continue to collect data on the sources of patient referrals.
Acknowledgments
The authors acknowledge the support of the John D. and Catherine T. MacArthur Foundation and the Center for Mental Health Services and the statistical contributions of Steven C. Marcus, M.A.
The authors are with the office of research at the American Psychiatric Association, 1400 K Street, N.W., Washington, D.C. 20005. Dr. Pincus and Terri L. Tanielian, M.A., are coeditors of this column.

Figure 1. Sources of patient refereals to psychiatrists (N=844)1
1Information was missing for five respondents. Percentages do not add to 100 due to rounding.

Figure 2. Mean number of patients treated per week and referrals received per month by psychiatrists (N=860), by primary work setting
1. Zarin DA, Pincus HA, Peterson BP, et al: Characterizing psychiatry with findings from the 1996 National Survey of Psychiatric Practice. American Journal of Psychiatry 155:397-404, 1998Link, Google Scholar


