Community-Level Correlates of Hospitalizations for Persons With Schizophrenia
The Centers for Disease Control and Prevention estimates that there are 2.3 schizophrenia-related (primary and secondary diagnoses) hospitalizations per 1,000 adults ( 1 ). Among hospitalized adults up to age 65, schizophrenia is the fourth most commonly diagnosed illness and has the seventh longest mean length of hospital stay (13.0 days) ( 2 ). The mean cost per hospitalization for individuals with schizophrenia is $18,300 ( 2 ). A majority (54%) of hospitalizations for schizophrenia are covered by Medicaid ( 2 ). Despite the prevalence and cost, little is known about community-level risk factors associated with hospitalizations for people with schizophrenia.
The pathway leading to hospitalization is complex. Social-ecological theory ( 3 , 4 , 5 , 6 ) suggests that it depends jointly on individual-level and community-level risk factors. The contribution of community-level risk factors is supported by observations that geographic variations in health outcomes do not disappear when individual risk factors are controlled for statistically ( 7 ). Davidson and colleagues ( 8 ) provided a conceptual framework for evaluating the impact of community-level sociodemographic, economic, and health system factors on the utilization of services among vulnerable populations. In this analysis we examined the association between hospitalization rates for persons with schizophrenia and community-level correlates using spatially referenced data sets containing information about hospitalizations, socioeconomic characteristics, and health care systems.
The socioeconomic characteristics of the community, such as ethnicity, poverty, and education, can influence schizophrenia-related hospitalization rates through various mechanisms, including prevalence, stigma, social support, and availability of informal resources. Numerous studies have shown that the prevalence rates for schizophrenia (approximated by hospital admissions) are higher in urbanized areas ( 9 , 10 , 11 , 12 ) with low socioeconomic status ( 13 , 14 , 15 , 16 ). Two hypotheses have been proposed to explain these findings. The social causation hypothesis postulates that the environmental stress associated with living in poverty and with high population density increases the incidence of schizophrenia. The social drift hypothesis argues that functional disability forces individuals with schizophrenia to migrate to low-income inner-city areas, where the cost of living is lower ( 14 ) and access to health and human services is better ( 17 ). Because both causal mechanisms may be at work, we expected that hospitalization rates would be higher in urban areas and in areas with lower incomes and higher rates of unemployment, poverty, and housing stress.
The characteristics of the local health care system may also influence schizophrenia-related hospitalizations because access to high-quality outpatient treatment might help in avoiding preventable hospitalizations. Alternatively, access to outpatient services may increase the appropriate detection of patients requiring hospitalization ( 18 ). Thus we had no expectations about whether health insurance coverage or outpatient provider supply would be associated with higher or lower hospitalization rates. With respect to inpatient services, Wennberg and colleagues ( 19 ) have reported that bed supply is correlated with hospitalization rates across a wide range of diagnoses, including mental health disorders. We expected that bed supply would also be positively correlated with hospitalization rates for schizophrenia. Conversely, the evaluations of both the Utah and Massachusetts managed care programs found that hospitalization rates decreased after the initiation of managed care for Medicaid recipients with serious mental illness ( 20 , 21 ). Consequently, we expected that health maintenance organization (HMO) market penetration would be negatively correlated with hospitalization rates for schizophrenia.
In addition to examining the correlates of hospitalization, we also examined the spatial variation in hospitalization to identify geographic areas with higher than expected rates. Payers may want to consider targeting these areas with programs designed to reduce the number of preventable admissions for schizophrenia.
Methods
Data sources
To conduct the analysis, it was necessary to define communities geographically, and we chose the county as the unit of analysis. Our choice was purely pragmatic and was motivated by the fact that a great deal of information about communities is aggregated at the county level. Counties offer an appropriate level of aggregation for analyzing hospitalizations, whereas a smaller geographical unit (such as zip codes) would have yielded zero hospitalizations too frequently to be analyzed.
Schizophrenia-related hospitalizations were extracted from the Statewide Inpatient Database developed by the Agency for Healthcare Research and Quality. The database contains the universe of hospital discharge records from all hospitals in participating states. Data from 2000 were extracted for the following 14 states: Arizona, Colorado, Florida, Iowa, Kentucky, Maine, New Jersey, New York, North Carolina, Oregon, South Carolina, Washington, West Virginia, and Wisconsin. Although 17 states contributed data to this database in 2000, only 14 provided patient zip code data needed for this project. Note that the counties included in the analysis were not randomly sampled. However, there were no substantial differences between the counties in the analytical data set and all U.S. counties with respect to the community-level correlates examined.
Hospitalization rates
The database includes data about the patient's zip code (regardless of residential location), primary diagnosis, and up to nine secondary diagnoses. Because unique patient identifiers were not available from most states, the data reflect multiple admissions for some individuals. Hospitalizations with a primary or secondary diagnosis of schizophrenia ( ICD-9-CM code 295.xx) were geocoded to the patient's county of residence. Using age-sex categories defined by the U.S. Census Bureau, we categorized each inpatient into one of 20 age-sex groups (age groups: 0–24, 25–29, 30–34, 35–44, 45–54, 55–59, 60–64, 65–74, 75–84, and 85 and older). The hospitalization rate for each age-sex category was calculated by dividing the number of schizophrenia-related hospitalizations in each age-sex category aggregated across the 14 states by the population in each age-sex category aggregated across the 14 states as reported in the 2000 census. The expected number of schizophrenia-related hospitalizations for each county was calculated by multiplying the age-sex hospitalization rates by the county population in each age-sex category and summing these products across all age-sex categories. The indirectly standardized hospitalization rate (SHR) for each county was then defined as the ratio of the observed to the expected number of hospitalizations ( 22 ).
Community-level correlates
Rurality in 2000 was measured at the county level with two indicators. The first was that the county did not meet the U.S. Office of Management and Budget's definition of a metropolitan statistical area. The Office of Management and Budget defines a county as a metropolitan statistical area if it contains an urbanized area (population ≥50,000) or is adjacent to such a county and 25% of the employed population commutes to the urbanized area (or vice versa). Rurality was also measured at the county level with urban influence codes (UICs) ( 23 ). For this measure counties are divided into 12 categories according to their population, adjacency to an urbanized area, and the proportion of workers commuting to urbanized areas.
Sociodemographic variables included percentage of the population that was African American, Asian American, Native American, or Hispanic as defined and measured by the 2000 census. Other socioeconomic variables from the census included percentage below the federally designated poverty level, percentage with a high school education, median household income (1999 dollars), and percentage unemployed (among persons aged 16 and older). With 2000 data compiled by the U.S. Department of Agriculture, counties were classified as housing stressed if 30% or more of households had one or more of the following: lacked complete plumbing, lacked a complete kitchen, renter or owner paid 30% or more of income for mortgage or rent, or had more than one person per room. Economic data for 2000 generated by the U.S. Department of Agriculture classified counties into one of six mutually exclusive categories indicating whether the economy of the county was dependent on farming, mining, manufacturing, federal or state government, or services or was not dependent on a specialized sector ( 24 ).
Health system data for 2000 from the Health Resources and Services Administration's Area Resource File included the number of nonpsychiatrist physicians, psychiatrists, psychologists, and social workers per 1,000 people, number of hospital beds per 1,000 people, the market penetration rate of HMOs, and dummy variables indicating whether the county had a community mental health center or was designated as a health professional shortage area ( 25 ). Finally, we also included the longitude and latitude of the counties, because hospitalization rates seem to vary east to west and north to south.
Statistical analysis
Counties were specified as the unit of the ecological regression analysis. On the basis of previous research ( 23 , 24 ), we expected SHRs among contiguous (neighboring) counties to be correlated and the observations to not be independently distributed ( 26 ). Therefore, we used spatial regression analysis, which accounts for the spatial autocorrelation among contiguous counties ( 27 , 28 ). Because the spatial regression models used in the second stage of the analysis were computationally intensive, it was necessary to first identify a parsimonious model specification with a nonspatial regression analysis. Backward selection techniques (using negative binomial regression and a cutoff level of p<.2) were used to identify variables to include in the parsimonious model specification. All community-level correlates described above were included as candidates in the backward selection analysis.
The spatial regression analysis used a conditional autoregressive model to account for the spatial autocorrelation among contiguous counties. Because some counties with small populations had extremely high or low SHRs (probably because of random variation over time) ( 29 ), we used Bayesian smoothing methods, which took advantage of the spatial autocorrelation present in the data ( 30 ). Specifically, we specified the Bayesian-Poisson conditional autoregressive model proposed by Besag and colleagues ( 31 ), as implemented in the statistical software GeoBugs ( 32 ). This Bayesian spatial regression model is described in detail in our companion article, which describes the model's use in analyzing depression-related hospitalization rates ( 27 ), and by Moreno and colleagues ( 33 ), who used it to identify spatial clustering of patients with schizophrenia in Spain.
We also estimated the parameters of the Bayesian-Poisson model without the conditional autoregressive term to determine whether spatial autocorrelation was present in the data. Specifically, we used the deviance information criterion to compare whether the Bayesian-Poisson autoregressive model had better goodness of fit than the simple Bayesian-Poisson model ( 34 ). Smaller deviance criterion values represent better goodness of fit. However, because the criterion has no known distribution, a statistical test was not performed.
Identifying outlier counties
We identified outlier counties that had SHRs 25% less than and 33% greater than the standardized rate (or SHRs <.75 and >1.333). Note that these cutoffs are symmetrical around an SHR value of 1: 1.33=1/(1–.25). Two methods were used to identify outlier counties. The first method examined raw SHR data. However, because the SHRs in counties with small populations are sensitive to random variations in hospitalizations over time, this method was prone to incorrectly identifying small counties as outliers. The population of the smallest county in the sample was 436. Therefore, the second method examined smoothed SHR data, which exploited the spatial autocorrelation. Specifically, smoothed SHRs were calculated as the ratio of the smoothed observed number of hospitalizations to the smoothed expected number of hospitalizations. The smoothed observed number of hospitalizations was a conditional expectation derived from the Bayesian-Poisson conditional autoregressive model that included an intercept, a spatially correlated error term for each county, and a subject heterogeneity error but did not include any covariates. Inclusion of the spatially correlated error term smoothed the observed number of hospitalizations, especially for the counties with small populations. Inclusion of the subject heterogeneity error took into account the variability across counties. The smoothed expected number of hospitalizations was a conditional expectation derived from the Bayesian-Poisson conditional autoregressive model that included an intercept and a spatially correlated error term for each county but did not include a subject heterogeneity error or any covariates. Counties that had smoothed SHRs 25% less than and 33% greater than the standardized rate (smoothed SHRs <.75 and >1.333) were identified as outliers.
Results
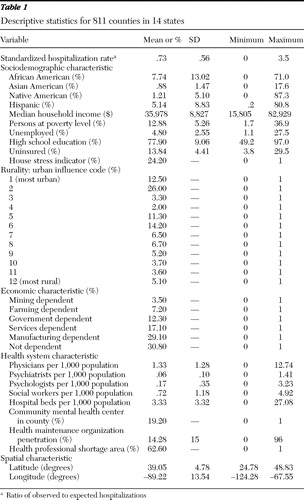
In 2000 the 14 states had 811 counties and a total population of 89,596,958. The Statewide Inpatient Database contained 11,280,866 hospital discharges for the 14 states. Among the 65,090,031 residents aged 20 and above, 143,107 schizophrenia-related hospitalizations were recorded in the database. The overall schizophrenia-related hospitalization rate in these 811 counties was 1.6 per 1,000 residents aged 20 and above, and the average of the SHR values across counties was .73, which reflects the fact that the distribution was not normal (that is, distribution was skewed to the right). Table 1 presents descriptive statistics for the 811 counties.
 |
Twenty-five community-level correlates were included in the Bayesian-Poisson autoregressive model (see Table 2 ). Exponentiating the parameter estimate yielded the relative incidence rate (the change in the county hospitalization rate corresponding to a one-unit increase in the independent variable). Counties with higher proportions of residents living in poverty and unemployed had significantly higher hospitalization rates, whereas those with a higher proportion of uninsured had significantly lower hospitalization rates. An increase of 10 percentage points in poverty and unemployment was associated with an increase in hospitalization rates of 35.0%, and 52.2% respectively. An increase of 10 percentage points in uninsured was associated with a decrease in hospitalization rates of 10.4%. Counties classified as housing stressed also had significantly lower rates of hospitalization.
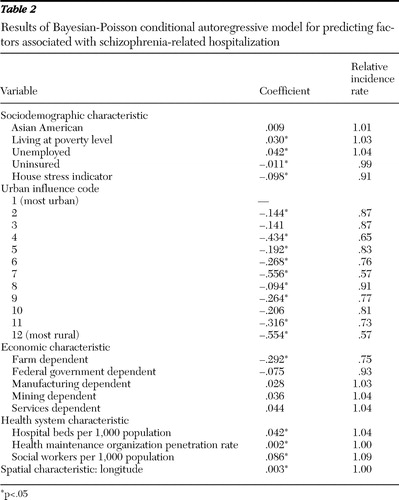 |
Counties designated as metropolitan statistical areas had insignificantly (p>.05) higher rates of hospitalization than counties not designated as metropolitan statistical areas (results not reported). However, compared with the most urban counties (in UIC category 1, population greater than one million), all other counties (in UIC categories 2–12) had lower hospitalization rates. Counties classified into eight of the UIC categories had significantly lower hospitalization rates (in UIC categories 2, 4–9, 11, and 12) compared with those classified as UIC category 1. The most rural counties (in UIC category 12, county population <10,000, without town population >2,500 and not adjacent to a county with population >10,000) had a substantially (43%) lower rate of hospitalizations. In addition, counties with farm-dependent economies had significantly and substantially (25.3%) lower hospitalization rates.
The supply of hospital beds and social workers and the HMO market penetration rate were all significantly and positively associated with hospitalization rates. Each additional hospital bed per 1,000 was associated with a 4.3% increase in the hospitalization rate, and each additional social worker per 1,000 was associated with a 9.0% increase in the hospitalization rate. An increase of 10 percentage points in the proportion of the population enrolled in an HMO was associated with an increased hospitalization rate of 1.7%. Longitude was also a significant predictor, indicating that hospitalization rates for schizophrenia were higher in the eastern states included in this analysis.
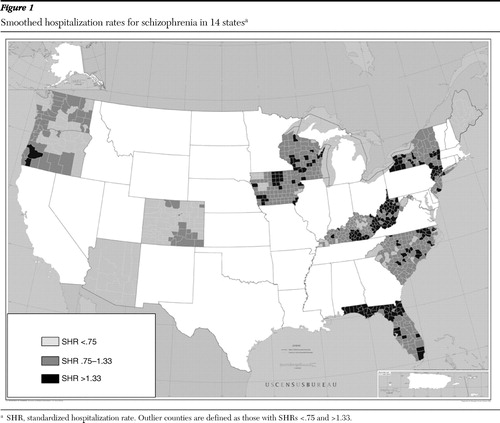
The deviance information criterion value for the Bayesian-Poisson autoregressive model was 5,897.65, compared with 5,865.12 for the simple Bayesian-Poisson model. This finding indicates that spatial autocorrelation was present in the data. In addition, there were four fewer significant explanatory variables in the conditional autoregressive model than in the simple model. These findings support the use of Bayesian smoothing methods to identify outlier counties. On the basis of the raw data, 68.3% of the counties were outliers (44% with SHR <.75 and 24% with SHR >1.33). The large proportion of outliers in the raw data highlights the problem of estimating rates of rare hospitalizations in counties with small populations. The average of the smoothed SHR values across counties was 1.08. On the basis of the smoothed data, 46% of the counties were outliers (21% with SHR <.75 and 25% with SHR >1.33) ( Figure 1 ; this map can be viewed in more detail in the online supplement to this article at ps.psychiatryonline.org ).
Discussion
Our observed rate of 1.6 schizophrenia-related hospitalizations per 1,000 adults is similar to national estimates from the Centers for Disease Control and Prevention (2.3 hospitalizations per 1,000 adults) ( 1 ). Some hospitalizations can be prevented with appropriate outpatient treatment, and improved access to specialty mental health outpatient treatment could have prevented some of these hospitalizations. However, we found no evidence that the supply of mental health specialists reduced hospitalization rates. Nevertheless, it may be that unobserved variation in the availability of specific types of programs or the quality of mental health services affected hospitalization rates.
An important finding was that schizophrenia-related hospitalization rates were higher in counties with high levels of poverty and unemployment. This finding is consistent with previous research ( 13 , 14 , 15 ) and suggests that individuals living in disadvantaged communities are at increased risk of schizophrenia-related hospitalizations. Using identical methodology, we found in a previous study that hospitalization rates for depression were also positively correlated with rates of poverty and unemployment, although the size of the effect was much smaller for depression than for schizophrenia ( 27 ).
We found a substantial inverse relationship between rurality and hospitalization rates for schizophrenia, which confirms and extends previous findings. This finding is consistent with studies reporting higher schizophrenia prevalence rates in inner-city areas ( 9 , 10 , 11 , 12 ). An alternative, but not mutually exclusive, explanation is that the propensity to hospitalize individuals with schizophrenia is higher in urban areas. Urban risk factors may include weaker social networks or more exposure to the criminal justice system. Similarly, the increased access to health and human services in urban areas could improve the detection of individuals in need of inpatient psychiatric services. However, we specifically controlled for provider supply and found little evidence that it influenced hospitalization rates. We also controlled for available inpatient beds, so the observed rural-urban effect is not explained by access to inpatient services.
We found a significant relationship between schizophrenia-related hospitalization rates and the supply of available hospital beds. This finding is consistent with previous studies that reported that bed supply was correlated with hospitalization rates across a wide range of diagnoses ( 19 ). The magnitude of the bed supply effect for schizophrenia is more than double the effect size for depression ( 27 ). The positive correlation between bed supply and hospitalization rate is often interpreted as evidence for supplier-induced demand, and the magnitude of the effect has been found to be stronger for discretionary admissions ( 19 ). We found that counties with higher rates of uninsured persons had lower rates of hospitalization, a finding that also suggests discretion concerning hospitalizations for schizophrenia. The uninsured often have incomes too high to qualify for Medicaid and too low to afford private insurance ( 35 ), and prior research has found that those without insurance are less likely to be hospitalized for schizophrenia compared with those with Medicaid or private insurance ( 36 ). Managed care cost-containment strategies are intended to minimize discretionary hospitalizations, but contrary to expectations, HMO penetration rates were found to be positively correlated with hospitalization rates for schizophrenia. This finding is not consistent with the results of the Utah and Massachusetts managed care evaluations, which both reported that hospitalization rates decreased after the introduction of managed care for Medicaid recipients with serious mental illness ( 20 , 21 ).
There are several limitations to the analysis. The first is the modifiable areal unit problem. Results may differ depending on the geographical unit of analysis, including both the definition of scale and the specification of boundaries ( 37 ). Although counties seem to be an appropriate unit of analysis, results may have differed if we had specified census tracts, zip codes, or states as the unit of analysis. A second limitation is that whenever the unit of analysis is a geographic area rather than an individual, there is the potential for ecological fallacy ( 5 ). Although individual risk factors for hospitalization are reflected in the aggregate correlations between community risk factors and hospitalization rates, interpretations about causation at the level of the individual must be made cautiously, especially because the data are cross-sectional ( 37 ). Moreover, interpretation about causation at any level should be made cautiously, because community-level hospitalization rates are influenced by a complex set of underlying factors, including prevalence, help-seeking behaviors, insurance policies, availability of services, and quality of care. A third limitation is that the SHRs reflect both initial admissions and readmissions because unique patient identifiers were not available. Olfson and colleagues ( 38 ) reported a 24.4% readmission rate within three months of discharge for a sample of Medicaid inpatients with schizophrenia. Finally, the inclusion of community-level correlates in our analysis was partially based on their being publicly available in secondary data sources. Many important community-level risk factors, such as homelessness rates, access to supportive housing, and availability of recovery-oriented programs, were not included in our analysis.
Conclusions
Despite the limitations described above, this study provided the first national data about the community-level correlates of hospitalization rates for schizophrenia. The analysis was conducted with a high-quality database that provided systematically coded information on all hospitalizations in 14 states across the country. Our results highlight the large number of schizophrenia-related hospitalizations, some of which may have been preventable. Similar to Wennberg's research ( 19 ), our findings indicated substantial geographic variation in hospitalization rates. This variation should be of interest to Medicaid programs that pay for the majority of schizophrenia-related hospitalizations ( 2 ). In particular, the prominent geographic clusters with higher rates of schizophrenia-related hospitalizations in New York, West Virginia, Kentucky, Florida, and Iowa should be of interest to Medicaid programs in these states.
Acknowledgments and disclosures
This research was supported by grant 1U-1CRH03713-01-00 from the Western Interstate Commission for Higher Education Rural Mental Health Center of the Health Resources and Services Administration.
The authors report no competing interests.
1. Kozak LJ, Owings MF, Hall MJ: National Hospital Discharge Survey: 2002 Annual Summary With Detailed Diagnosis and Procedure Data. Atlanta, Ga, Centers for Disease Control and Prevention, National Center for Health Statistics, 2005Google Scholar
2. Merrill CT, Elixhauser A: Hospitalization in the United States, 2002. H-CUP Fact Book No 6, AHRQ pub no 05-056. Rockville, Md, Agency for Healthcare Research and Quality, 2005Google Scholar
3. Stokols D: Translating social ecological theory into guidelines for community health promotion. American Journal of Health Promotion 10:282–293, 1996Google Scholar
4. Stokols D: Establishing and maintaining healthy environments: toward a social ecology of health promotion. American Psychologist 47:6–22, 1992Google Scholar
5. Blakely TA, Woodward AJ: Ecological effects in multi-level studies. Journal of Epidemiology and Community Health 54:367–374, 2000Google Scholar
6. Greenland S: Ecologic versus individual-level sources of bias in ecologic estimates of contextual health effects. International Journal of Epidemiology 30:1343–1350, 2001Google Scholar
7. Patrick DL, Wickizer TM: Community and health, in Society and Health. Edited by Amick BC, Levine S, Tarlov AR, et al. New York, Oxford University Press, 1995Google Scholar
8. Davidson PL, Anderson RM, Wyn R, et al: A framework for evaluating safety-net and other community-level factors on access for low-income populations. Inquiry 41:21–38, 2004Google Scholar
9. Maylath E, Seidel J, Werner B, et al: Geographical analysis of the risk of psychiatric hospitalization in Hamburg from 1988–1994. European Psychiatry 14:414–425, 1999Google Scholar
10. Dekker J, Peen J, Gardien R, et al: Urbanisation and psychiatric admission rates in the Netherlands. International Journal of Social Psychiatry 43:235–246, 1997Google Scholar
11. Eaton WW, Mortensen PB, Frydenberg M: Obstetric factors, urbanization and psychosis. Schizophrenia Research 43:117–123, 2000Google Scholar
12. Lewis G, David A, Andreasson S, et al: Schizophrenia and city life. Lancet 340:137–140, 1992Google Scholar
13. Saraceno B, Levav I, Kohn R: The public mental health significance of research on socio-economic factors in schizophrenia and major depression. World Psychiatry 4(3): 181–185, 2005Google Scholar
14. Thornicroft G: Social deprivation and rates of treated mental disorder: developing statistical models to predict psychiatric service utilisation. British Journal of Psychiatry 158: 475–484, 1991Google Scholar
15. Goldner EM, Jones W, Waraich P: Using administrative data to analyze the prevalence and distribution of schizophrenic disorders. Psychiatric Services 54:1017–1021, 2003Google Scholar
16. Koppel S, McGuffin P: Socio-economic factors that predict psychiatric admissions at a local level. Psychological Medicine 29:1235–1241, 1999Google Scholar
17. McCarthy JF, Valenstein M, Blow FC: Residential mobility among patients in the VA health system: associations with psychiatric morbidity, geographic accessibility, and continuity of care. Administration and Policy in Mental Health 34:448–455, 2007Google Scholar
18. Hendryx MS, Rohland BM: A small area analysis of psychiatric hospitalizations to general hospitals: effects of community mental health centers. General Hospital Psychiatry 16:313–318, 1994Google Scholar
19. Wennberg JE, Cooper MM, Bubolz TA, et al: The Dartmouth Atlas of Health Care. Chicago, American Hospital Publishing, 1996Google Scholar
20. Christianson JB, Manning W, Lurie N, et al: Utah's prepaid mental health plan: the first year. Health Affairs 14(3):160–172, 1995Google Scholar
21. Dickey B, Normand SL, Norton EC, et al: Managing the care of schizophrenia: lessons from a 4-year Massachusetts Medicaid study. Archives of General Psychiatry 53:945–952, 1996Google Scholar
22. Gotway C, Waller L: Applied Spatial Statistics for Public Health Data. Hoboken, NJ, Wiley, 2004Google Scholar
23. Hart LG, Larson EH, Lishner DM: Rural definitions for health policy and research. American Journal of Public Health 95: 1149–1155, 2005Google Scholar
24. Economic Research Service County Typology Codes. Washington, DC, US Department of Agriculture, 2004. Available at www.ers.usda.gov/Data/TypologyCodes Google Scholar
25. Area Resource File. Fairfax, Va, Quality Resource Systems, 2006. Available at www.arfsys.com Google Scholar
26. Youssef HA, Kinsella A, Waddington JL: Evidence for geographical variations in the prevalence of schizophrenia in rural Ireland. Archives of General Psychiatry 48:254–258, 1991Google Scholar
27. Fortney J, Rushton G, Wood S, et al: Community-level risk factors for depression hospitalizations. Administration and Policy in Mental Health 34:343–352, 2007Google Scholar
28. Clayton DG, Bernardinelli L, Montomoli C: Spatial correlation in ecological analysis. International Journal of Epidemiology 22: 1193–1202, 1993Google Scholar
29. Lin SP, Goodman AB: Geographic variations in the prevalence of schizophrenia. Archives of General Psychiatry 49:906–908, 1992Google Scholar
30. Clayton D, Kaldor J: Empirical Bayes estimates of age-standardized relative risks for use in disease mapping. Biometrics 43:671–681, 1987Google Scholar
31. Besag J, York J, Mollie A: Bayesian image restoration, with two applications in spatial statistics. Annals of the Institute of Statistical Mathematics 43:1–59, 1991Google Scholar
32. Thomas A, Best N, Arnold R, et al: GeoBugs User Manual (Version 1.1 Beta). Cambridge, United Kingdom, Medical Research Council, Biostatistics Research Unit, 2002. Available at www.mrc-bsu.cam.ac.uk/bugs Google Scholar
33. Moreno B, Garcia-Alonso CR, Negrin Hernandez MA, et al: Spatial analysis to identify hotspots of prevalence of schizophrenia. Social Psychiatry and Psychiatric Epidemiology 43:782–791, 2008Google Scholar
34. Spiegelhalter DJ, Best NG, Carlin BP, et al: Bayesian measures of model complexity and fit. Journal of the Royal Statistical Society: Series B 6:583–639, 2002Google Scholar
35. Duncan RP, Porter CK, Garvan CW, et al: The 2004 Florida Health Insurance Study: Telephone Survey Findings. Gainesville, Fla, University of Florida, Department of Health Services Research, Management and Policy, 2005Google Scholar
36. Rabinowitz J, Bromet EJ, Lavelle J, et al: Relationship between type of insurance and care during the early course of psychosis. American Journal of Psychiatry 155:1392–1397, 1998Google Scholar
37. Joseph AE, Hollett RG: On the use of socio-demographic indicators in local health planning: a Canadian non-metropolitan perspective. Social Science and Medicine 37:813–822, 1993Google Scholar
38. Olfson M, Mechanic D, Boyer CA, et al: Assessing clinical predictions of early rehospitalization in schizophrenia. Journal of Nervous and Mental Disease 187:721–729, 1999Google Scholar