Hospitalization Patterns for Psychiatric Disorders Across the Lifespan in Australia From July 1998 to June 2005
Commencing in 1992 Australia has had three consecutive national mental health plans that have focused on reforming an institutionally based mental health system to one that is consumer focused and emphasizes supporting individuals in their communities ( 1 ). Reform was supported by increased national mental health expenditure. Indexed against the 2002–2003 Australian dollar (AUD), mental health funding rose from $1.97 billion AUD in 1992–1993 to $2.56 billion AUD in 1999–2000 and to $3.33 billion AUD in 2002–2003; the 2002–2003 mental health budget comprised federal (36.3%), state (59.3%) and private health (4.4%) funds ( 1 ). Much of the additional funding was channeled into early prevention, mental health awareness, primary care, and community services, with relatively little focus on supported accommodation and subacute care. There has been variation between the states and territories and criticism that reform has been slow ( 2 ).
Information from community prevalence studies of psychiatric disorders has been instrumental in guiding national and regional mental health plans and provision of mental health services ( 3 ). Although clearly applicable to primary health care and ambulatory specialist mental health services, community-derived data may not be sufficient to enable accurate planning of inpatient mental health services. Relatively few studies have investigated the associations between age, gender, psychiatric diagnosis, and psychiatric hospitalization. An examination of patterns of hospital admissions for adult (16–64 years) psychiatric disorders in England found discrepancies with population morbidity surveys (4); in particular there were more admissions of males than females. Several studies have reported that length of stay varies with primary psychiatric diagnosis and age, although age effects within diagnostic groups have not been closely examined ( 4 , 5 ).
The aim of this study was to determine the population-adjusted effects of age and gender on specialized psychiatric hospitalization for primary psychiatric disorders in Australia.
Methods
Seven years of data, from July 1998 to June 2005, are presented from Australia's National Hospital Morbidity Database (NHMD) ( 6 ). This database comprises data supplied by all public and most private hospitals in Australia, and the data were aggregated by the Australian Institute of Health and Welfare. Specialized psychiatric discharges (known in Australia as psychiatric separations), were defined as discharges, transfers, deaths, or changes in care where the patient spent one day or more in a specialized psychiatric unit or hospital. The principal diagnosis was defined as the diagnosis chiefly responsible for the hospitalization episode. Diagnoses were made with the Australian Modification of the ICD-10 ( ICD-10-AM ). Adults aged 20 years and older were included. This was a publicly available deidentified data set; hence institutional review board approval was not obtained.
For all specialized psychiatric discharges across the seven years, 95.5% of persons discharged had a principal diagnosis of a mental or behavioral disorder. The rest were for injury, poisoning, and other consequences of external causes (1.4%); factors influencing health status and contact with health services (1.2%); diseases of the nervous system (.6%); and other ICD-10-AM diagnostic groups (<.5% each). The NHMD does not include secondary or co-occurring diagnoses.
ICD-10-AM mental and behavioral disorder codes were grouped as follows: F00–04, dementia and amnestic syndromes; F05, delirium; F06–09, other organic brain syndromes; F10, alcohol-related disorders; F11–19, substance use disorders; F20–29, schizophrenia, schizotypal, and delusional disorders; F30–31, manic disorders; F32–39 and F41.2, depressive disorders; F40–48 (except for F41.2), neurotic, stress-related, and somatoform disorders; F50–59 and F63–69, other behavioral disorders; F60–62, personality disorders; F70–79, mental retardation; and F80–99, other psychiatric disorders.
Using national population data for each year linearly extrapolated from the 1996, 2001, and 2006 Australian censuses, we calculated discharge rates per 1,000 persons by psychiatric diagnostic group, age, gender, and year. Average length of stay per discharge was also calculated.
Results
A total of 1,343,584 discharges were recorded between July 1998 and June 2005. There were 146,305 discharges in the period 1998–1999, which rose gradually to 187,468 discharges in 2004–2005; the average annual discharge rate for the study period was 167,948. There was an 18.0% increase in the annual rate of psychiatric discharges during the study period, from 11.1 to 13.1 discharges per 1,000 adults (Pearson's r =.993, p<.001), and a 20.3% decrease in the days of treatment, from 13.3 days to 10.6 days per admission (Pearson's r=-.842, p<.001). Overall, there were more discharges for women (13.2 per 1,000) than men (11.0 per 1,000; χ2 =9,798, df=1, p<.001); however, length of stay was longer for men (14.0 days) than for women (10.3 days) ( χ2 =3,771, df=1, p<.001). The proportion of total discharges that resulted from involuntary hospitalizations was higher for men (25.5%) than for women (14.6%) ( χ2 =20,985, df=1, p<.001).
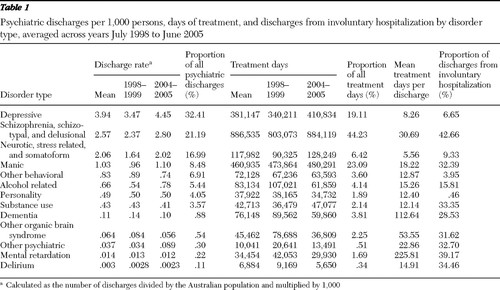
Table 1 shows the annual rate of discharges per 1,000 persons by diagnostic category, average length of stay per admission, and proportion of discharges from involuntary hospitalization. The increase in rate of discharges and length of stay was more notable with more prevalent diagnoses.
 |
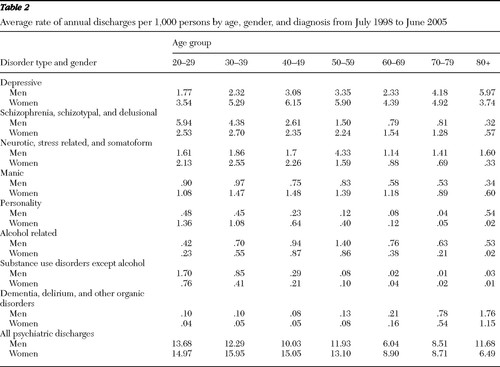
For each year, similar patterns of discharges were observed for diagnostic group, age, and gender. Table 2 shows the average annual rate of discharges per 1,000 persons by diagnosis, age, and gender. Generally discharge rates fell by age for men (Pearson's r=-.710, p<.001) and women (Pearson's r=-.908, p<.001). For depressive disorders, discharges increased with age for men (Pearson's r=.804, p<.001) and decreased with age for women (Pearson's r=-.908, p<.001). Discharges for schizophrenia and for schizotypal and delusional disorders fell with age (for men, Pearson's r=-.953, p<.001; for women, Pearson's r=-.919, p<.001), starting at a higher rate and falling more for men (z=1,382, p<.001). There were midlife peaks in discharges for neurotic, stress, and somatoform disorders (for men, quadratic regression b1=.654, b2=-.083, p<.001; for women, b1=.587, b2=-.082, p<.001). Discharges for mania also decreased with age (for men, Pearson's r=-.713, p<.001; for women, Pearson's r=-.969, p<.001). Hospital discharges fell across the lifespan for substance use disorders (for men, Pearson's r=-.605, p<.001; for women, Pearson's r=-.898, p<.001) and personality disorders, although there was a very-late-life peak in personality disorder discharges for men (for men, quadratic regression b1=-.286, b2=.030, p<.001; for women, Pearson's r=-.969, p<.001). For alcohol-related disorders there was a midlife peak in discharges (for men, quadratic regression b1=.654, b2=-.083, p<.001; for women, b1=.587, b2=-.082, p<.001). The rate of discharges for dementia, delirium, and other organic disorders increased, as expected, with age (for men, Pearson's r=.686, p<.001; for women, Pearson's r=.763, p<.001).
 |
Discussion
From 1998–1999 to 2004–2005, the rate of psychiatric discharges in Australia increased by 18.0%, and length of stay decreased by 20.3%. There were no major policy changes to mental health care over the study period; however, these data need to be viewed in the context of mental health service delivery changes.
The availability of psychiatric beds fell slightly, from 40 hospital and seven community beds per 100,000 persons in 1998–1999 to 38 hospital and six community beds per 100,000 in 2004–2005 ( 7 , 8 ). Nonacute long-stay beds fell from 14 per 100,000 in 1998–1999 to 11 per 100,000 in 2002–2003 ( 1 ). Consistent with mental health policy, between 2001–2002 and 2004–2005 service contacts for publicly funded community mental health and hospital outpatients increased from 215.3 per 1,000 to 254.6 per 1,000 in 2004–2005, with the most frequent diagnosis being schizophrenia; there were more contacts for males ( 8 ). In contrast, in private psychiatry, between 2001–2002 and 2004–2005 there was an average annual decline of 1.1% in the number of services per capita provided by private psychiatrists. Over the same period in primary care, despite an average annual increase of .3% of mental health-related encounters, there was an average annual decrease of 1.0% in mental health service occasions per capita provided by general practitioners, who were most commonly being consulted for treatment of depression and anxiety ( 8 ).
Hospital use depends on need and availability of beds and other services. The increases in hospital discharges may indicate that more individuals required treatment as a result of greater help seeking through improved national mental health literacy ( 9 ) or increased prevalence of disorders within the community. However, when service use increased in the United States, it was not due to increased prevalence of mental illness ( 10 ). The increase in admission rate may be due to greater difficulty in accessing private psychiatrists or general practitioners. Alternatively, the change in rates may reflect some individuals' having repeat discharges because fewer long-stay beds were available.
The 1997 National Survey of Mental Health and Wellbeing found that the 12-month prevalence of mental disorders in the Australian community was 17.4% for men and 18.0% for women ( 11 ). We found a slightly greater difference between hospitalization rates for women (13.2 per 1,000) than men (11.0 per 1,000), possibly because women are more likely to seek help ( 12 ). The length of stay was longer for men because of the higher hospitalization rate of men with schizophrenia and dementia—both conditions with relatively long lengths of stay—and possibly because of increased severity that can be inferred from the higher proportion of discharges from involuntary hospitalization.
Depressive disorders were the most frequent principal diagnosis at hospitalization, accounting for nearly one third of all discharges, followed by schizophrenia and delusional disorders (21%), then neurotic, stress, and somatoform disorders (17%). However, schizophrenia and delusional disorders accounted for the greatest proportion of treatment days (44%), followed by manic disorders (23%) and depression (19%). The prevalence of these disorders in Australia at the community level is 9.7% for anxiety disorders, 7.7% for substance use disorders, 5.8% for affective disorders ( 11 ), and .47% for psychotic disorders among persons in contact with any treatment service ( 13 ). Hospitalization rates reflect a mixture of the community prevalence and severity of these disorders ( 14 ). Persons with dementia and other organic disorders accounted for 1.4% of discharges and 6.1% of treatment days. Although some patients who may require long-term care may account for this disparity, such patients have increasingly been transferred to residential facilities for elder care over the past 20 years.
Policy makers need to be aware that the number of psychiatric hospitalizations in Australia has been consistently increasing. Because hospital psychiatric rates do not exactly coincide with community prevalence rates, policy initiatives to decrease psychiatric hospitalization rates and lengths of stay and program managers who plan inpatient services need to take into account inpatient profiles. The most common admission profile was for middle-aged women with depression who stayed just over a week, followed by young men with schizophrenia who stayed for a month. The mixture of service needs must be considered; for instance, hospitalizing males and females together within psychiatric wards may cause women to feel vulnerable to sexual abuse and physical assault (17). United Kingdom policy recommends that acute mental health services have women-only facilities ( 15 ).
There are a number of limitations to this study. Data were for treatment episodes, not for individuals. The diagnoses were made by multiple clinicians and entered into medical records by multiple staff members; hence, accuracy of the data is unknown. Only principal diagnoses were reported, so the important effects of comorbidity could not be examined. Data on region were not available. Their generalizability to other countries is therefore not known.
This study also has important strengths. The data comprised seven years of discharges from all public and almost all private hospitals and covered the entire adult age range. The patterns of hospitalization by age, gender, and diagnosis were similar across the seven years, increasing our confidence in these results.
Conclusions
The rates of specialized psychiatric hospitalization in Australia varied according to age, gender, and primary psychiatric disorder and reflected a combination of community prevalence, clinical severity, bed availability, and help-seeking behavior. These data may be useful to policy makers and program managers in planning inpatient programs.
Acknowledgments and disclosures
Dr. Low was supported by grant 455377 from the National Health and Medical Research Council and the Australian Government's Dementia: A Health Priority Initiative. The authors thank the Australian Institute of Health and Welfare for compiling the data.
The authors report no competing interests.
1. National Health Report 2005: Summary of Ten Years of Reform in Australia's Mental Health Services Under the National Mental Health Strategy 1993–2003. Canberra, Commonwealth of Australia, Department of Health and Ageing, 2005Google Scholar
2. Whiteford HA, Buckingham WJ: Ten years of mental health service reform in Australia: are we getting it right? Medical Journal of Australia 182:396–400, 2005Google Scholar
3. National Mental Health Plan 2003–2008. Canberra, Australian Health Ministers, 2003Google Scholar
4. Thompson A, Shaw M, Harrison G, et al: Patterns of hospital admission for adult psychiatric illness in England: analysis of hospital episode statistics data. British Journal of Psychiatry 185:334–341, 2004Google Scholar
5. Brown SL: Variations in utilization and cost of inpatient psychiatric services among adults in Maryland. Psychiatric Services 52:841–843, 2001Google Scholar
6. Separation, Psychiatric Care Day and Patient Day Statistics for Separations With Specialised Psychiatric Care by Principal Diagnosis in ICD-10-AM, Australia, 1998–99 to 2004–05. Canberra, Australian Institute of Health and Welfare, 2007Google Scholar
7. National Mental Health Report 2004. Canberra, Commonwealth of Australia, Department of Health and Ageing, 2004Google Scholar
8. Mental Health Services in Australia 2004–5. Canberra, Australian Institute of Health and Welfare, 2007Google Scholar
9. Jorm AF, Christensen H, Griffiths KM: The public's ability to recognize mental disorders and their beliefs about treatment: changes in Australia over 8 years. Australian and New Zealand Journal of Psychiatry 40:36–41, 2006Google Scholar
10. Kessler RC, Demler O, Frank RG, et al: Prevalence and treatment of mental disorders, 1990 to 2003. New England Journal of Medicine 352:2515–2523, 2005Google Scholar
11. Mental Health and Wellbeing: Profile of Adults, Australia 1997. Canberra, Australian Bureau of Statistics, 1998Google Scholar
12. Issakidis C, Andrews G: Who treats whom? An application of the pathways to care model in Australia. Australian and New Zealand Journal of Psychiatry 40:74–86, 2006Google Scholar
13. Jablensky A, McGrath J, Herrman H, et al: People With Psychotic Illness: Overview of the Methods and Results of the Study of Low Prevalence (Psychotic) Disorders as Part of the National Survey of Mental Health and Wellbeing. Canberra, Department of Health and Aged Care, 1999Google Scholar
14. Narrow WE, Rae DS, Robins LN, et al: Revised prevalence estimates of mental disorders in the United States: using a clinical significance criterion to reconcile 2 surveys' estimates. Archives of General Psychiatry 59:115–123, 2002Google Scholar
15. Mental Health Policy Implementation Guide: Adult Acute Inpatient Care Provision. London, Department of Health, 2002Google Scholar