Potentially Problematic Opioid Prescriptions Among Individuals With Private Insurance and Medicaid
Abstract
Objective:
Opioid analgesics can be safe and effective when used properly. Reducing prescriptions that increase adverse outcomes is a focus for addressing the opioid crisis. In this study, the rate of potentially problematic opioid prescriptions was examined over 11 years in a large sample of U.S. patients.
Methods:
Claims from the IBM MarketScan commercial database (about 45 million) and multistate Medicaid database (about 7 million) from 2005 to 2015 were used to calculate rates of the following potentially problematic prescription practices: prescriptions for high-dose opioids for 90 days or more, prescriptions from multiple providers, prescriptions of long-acting or extended-release opioids for acute pain, overlap between prescriptions for opioids, and overlap between prescriptions for opioids and benzodiazepines.
Results:
Among patients with an opioid prescription, about 8% of those with private insurance and about 14% of those with Medicaid coverage had at least two incidents of potentially problematic prescriptions per year. Over the study period, rates increased for some practices (opioid-benzodiazepine overlap) and decreased for others (prescriptions from multiple providers). Receipt of potentially problematic prescriptions was higher among older patients, female patients with private insurance, and whites and male patients covered by Medicaid.
Conclusions:
A significant percentage of patients who are prescribed opioids experience problematic prescription practices. Targeted policy and clinical interventions that reduce potentially problematic prescription could be a focus for addressing the U.S. opioid crisis.
HIGHLIGHTS
One in 13 enrollees in private insurance and one in seven Medicaid enrollees who were prescribed opioids had at least two indicators of a problematic prescription for each year between 2005 and 2015.
Receipt of problematic opioid prescription was higher among non-Hispanic whites than among African Americans and Hispanics.
Problematic prescriptions declined between 2005 and 2015 and declined more steeply among Medicaid enrollees than among those with private insurance.
Opioid analgesic misuse is a significant public health concern facing the United States (1, 2). In 2015, approximately 4 million people ages 12 years and older misused opioid analgesics (3). Opioid analgesic misuse is associated not only with substantial economic burden (4–6) but also with high mortality rates and significant morbidity, which lead to hospitalizations and emergency department visits (7–9). Additionally, misuse can lead to addiction, necessitating inpatient or outpatient treatment for substance use disorder. Opioid analgesic misuse is also a gateway to heroin use, which greatly increases the risk of accidental lethal overdose (10, 11). Deaths involving opioids increased more than threefold since 2000, reaching more than 15,000 in 2015 (12, 13).
Much opioid misuse originates from prescriptions intended for therapeutic use (14). The link between prescriptions intended for therapeutic use and misuse may be related to prescribing practices, patient drug-seeking behaviors, or both. Overprescribing of opioids, prescribing of long-acting opioids for acute pain, and/or overlapping prescriptions of multiple opioids or of opioids and benzodiazepines may unintentionally contribute to misuse (15–19). Examples of patient behaviors that can contribute to misuse include seeking opioids from multiple providers or pharmacies and using opioids for nonmedical reasons (20, 21). Patients who are exposed to these factors—all of which are considered problematic prescription practices—are at greater risk of opioid misuse (15, 22–24).
Estimating the prevalence of potentially problematic opioid prescriptions is important because of its link to misuse, which can increase morbidity and mortality. Although a wide variety of policies address opioid misuse, there is room for additional strategies, especially in reducing potentially problematic prescriptions. Previous studies that examined rates of potentially problematic prescriptions were limited to small databases, a small number of potentially problematic prescription practices, or both (25–28).
The purpose of this study was to estimate the overall rate of potentially problematic prescription practices stratified by demographic factors using a large database of commercial and Medicaid health insurance claims over an 11-year period. Potentially problematic opioid prescription practices were derived from the existing literature and from opioid prescribing guidelines (29).
Methods
Data
We used claims data from the 2005–2015 IBM MarketScan Commercial Claims and Encounters Database and the Multi-State Medicaid Database. These databases contain detailed patient-level claims provided directly by health plans and offer the largest convenience sample available in proprietary claims databases. The MarketScan databases are consistent with the definition of limited data sets under the Health Insurance Portability and Accountability Act Privacy Rule and contain no direct patient identifiers.
Sample Population and Setting
Each year, we identified individuals aged 18–64 years with a pharmacy claim for opioid analgesics in the commercial and Medicaid data. We restricted the sample to individuals who had at least 90 days of continuous enrollment that year and had no hospice claims or cancer diagnoses in the 12 months prior to their first opioid fill of the year. We excluded opioid pharmacy claims that appeared to be invalid (e.g., days’ supply of ≤0 or >365 or pill quantity of ≤0) or were outliers (pill quantity in the 99th percentile or higher). We also excluded from the Medicaid analysis any individuals who were dually eligible for Medicare and Medicaid because we did not have pharmacy claims paid by Medicare. In addition, for a more robust comparison of Medicaid and private insurance enrollees, we limited the sample to data contributors (employers, health plans, and states) that provided data for each of the years of the study. We excluded the private claims data from any state for which we did not have corresponding Medicaid data. After applying these criteria, we identified 45,921,008 private and 7,164,739 Medicaid enrollees with a valid opioid pharmacy claim over the entire study period.
Characteristics of Included Prescriptions
We included all forms of Schedule II–IV opioid pain medications (see Appendix Table A1 for a list of each included opioid and its associated morphine milligram equivalent conversion factor. Because methadone can also be used to treat opioid dependence, we used Healthcare Common Procedure Coding System service codes to identify and exclude claims for methadone for treatment of substance use disorders.
The MarketScan pharmacy claim does not include information on the prescriber or the reason (diagnosis) for the prescription. Therefore, to analytically determine the prescriber and the diagnosis, we looked back 7 days from the date of each opioid fill to identify the inpatient, outpatient, or emergency department claim that occurred closest to the fill date. We considered only outpatient visits in which an opioid could have been prescribed by using procedure and revenue codes, including 90791–2, 99201–5, 99211–5, 99217–20, 99241–5, 99341–5, 99347–50, 99384–7, 99394–7, G0463, H0034, H2000, H2010, T1015, 0510, 0515–7, 0519–23, 0526, 0528–9, 0911, and 0982–3. We assigned the provider ID on that claim to the opioid prescription. We used the diagnoses on this most recent claim to identify the reason for the opioid prescription. If there were no outpatient, inpatient, or emergency department claims in the 7 days prior to the fill date, we recorded the prescriber and reason as missing. If inpatient and outpatient date of service overlapped within the prior 7 days, we used the outpatient claim to identify the diagnosis. For refills, we assigned the prescriber and diagnosis from the initial fill.
Indicators of Potentially Problematic Prescription Behavior
We constructed five binary indicators of potentially problematic prescription practices on the basis of the previous literature (24, 30). In addition, we created a dichotomous variable to indicate whether the individual had two or more incidents of any of these five practices in each year of the study period. We defined high-dose opioids as opioid prescriptions for greater than 120 morphine milligram equivalent for 90 or more consecutive days. We calculated the daily dose of each opioid prescription by dividing the number of pills by days’ supply, which allowed us to measure the prescribed number of pills each day. We multiplied that number by pill strength to calculate daily total dose. We converted this number to the morphine milligram equivalent dose by using existing conversion factors established by the Centers for Disease Control and Prevention (31) (see Table A1, which is available as an online supplement to this article). If there were overlapping opioid prescriptions, we added the daily dose in morphine milligram equivalents for each prescription.
To identify long-acting opioid prescriptions written for acute pain, we used the National Drug Code to distinguish long-acting opioids from immediate-release opioids. We categorized pain as acute or chronic by using the Chronic Condition Indicator, a diagnosis classification tool developed as part of the Healthcare Cost and Utilization Project (32), applied to the first four diagnoses on the claim. Consistent with the literature (25, 27), we identified opioid overlap as instances in which a patient filled or refilled an opioid drug prescription while he or she still had a supply of seven or more days (assuming the drug was taken as prescribed on the pharmacy claim). We applied the same rule to identify opioid-benzodiazepine overlap, a potentially lethal combination given that both drugs sedate users, suppress breathing, and impair cognitive functions. To identify multiple providers, we counted the number of unique prescriber IDs associated with opioid claims for each person in each year. We categorized individuals with three or more opioid prescribers as having multiple prescribers.
Analytical Approach
We calculated the number and percentage of enrollees with any potentially problematic prescription practice, as well as the number and percentage of enrollees with each specific practice type (see Tables A2 and A3 in the online supplement). In our presentation of results, we focus on the percentage of patients with two or more incidents of long-acting opioid prescriptions for acute pain, high-dose opioids, multiple providers, and overlapping prescriptions as a conservative approach to identifying potentially problematic prescription practices. Rates were stratified by sex, age group, and health plan type for both private and Medicaid enrollees, by race and ethnicity for Medicaid enrollees only (we did not have complete race and ethnicity data for private insurance). Finally, we used the chi-square test to examine the significance of change in yearly rates compared with baseline (2005).
Results
Opioid Prescriptions and Demographic Characteristics
Population with private insurance coverage.
Among the privately insured population with at least one opioid pharmacy claim, approximately 43% were male. About 11% were ages 18 to 24; 19%, 25 to 34; 22%, 35 to 44; 26%, 45 to 54; and 22%, 55 to 64. More than 40% of this population received two or more opioid prescriptions per year, and the average number of prescriptions filled was approximately three (see Table A4 in the online supplement).
Population with Medicaid insurance coverage.
Among the Medicaid population who received at least one opioid prescription, 23% were male. About 26% were ages 18 to 24; 32%, 25 to 34; 19%, 35 to 44; 14%, 45 to 54; and 9%, 55 to 64. Approximately 60% of the population was white, 32% was African American, and 2% was Hispanic. Approximately 60% of this population had more than one opioid prescription per year, and the average number of prescriptions filled per year was approximately five.
Opioid Prescriptions by Health Insurance and Demographic Characteristics
Figure 1 shows that about 8% of individuals with private insurance and an opioid prescription had two or more incidents of any potentially problematic opioid prescription each year over the study period. Less than 1% of the commercial population in each year had at least two incidents of long-acting opioids for treatment of acute pain. The prevalence of having at least two incidents of overlap between one or more opioids or between opioids and benzodiazepines was more than 3% annually, and about 4% of enrollees received opioid prescriptions from three or more prescribers on at least two occasions. Less than .5% of the privately insured population had at least two incidents of receiving high-dose opioids for at least 90 consecutive days. The prevalence of multiple providers, opioid overlap, and receipt of long-acting opioids for acute pain decreased significantly (p<0.001) between 2005 and 2015. However, the prevalence of opioid-benzodiazepine overlap increased significantly (p<0.001) compared with the base year.

FIGURE 1. Indicators of potentially problematic opioid prescriptions among Medicaid and privately insured enrollees, 2005–2015a
aIndicators of a potentially problematic opioid prescription required evidence of at least two incidents of the problematic practice. Having any indicators of a problematic prescription required evidence of at least 2 incidents of the 5 listed indicators. The population included in this study had at least one opioid prescription. The difference in percentages between 2005 and 2015 was statistically significant (p<.001) for all indicators. Sources: IBM MarketScan Commercial Claims and Encounters and the IBM MarketScan Multi-State Medicaid data, 2005–2015. LA/ER, long-acting or extended release; BZD, benzodiazepine.
Figure 1 also shows that the percentage of Medicaid enrollees with at least one opioid prescription and two or more incidents of at least one problematic opioid prescription varied by year over the study period, with a high of 15% in 2007 and a little over 14% (or 1 out of 7 enrollees) over the study period. The percentage of the Medicaid enrollees with three or more prescribers reached 10% in 2007 and declined to 4.7% in 2015. Less than 2% of Medicaid enrollees had at least two incidents of receiving long-acting opioids for acute pain each year. The prevalence of at least two incidents of opioid or opioid-benzodiazepine overlap was approximately 5% and 9% on average, respectively, across the duration of the study period. Less than .5% of Medicaid enrollees had at least two incidents of high-dose opioids for 90 or more consecutive days. The prevalence of receiving high-dose opioids, having multiple providers, opioid-benzodiazepine overlap, and receiving long-acting opioids for acute pain decreased significantly (p<0.001) compared with the base year in 2005. In contrast, the prevalence of opioid overlap increased significantly (p<0.001) compared with the base year estimate. Over the final 4 years of the study period, all the indicators began to show declines from an interim peak.
Figure 2 demonstrates that, in general, for those with private insurance, each of the indicators of potentially problematic prescription increased with the age of the enrollee. The results by age stratification for Medicaid enrollees (see Figure A1 in the online supplement) were similar to those for private insurance (the prevalence of all indicators increased with age) but higher.
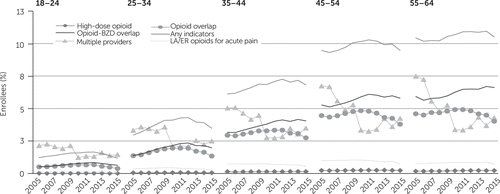
FIGURE 2. Indicators of potentially problematic opioid prescriptions among privately insured enrollees, 2005–2015, by agea
aIndicators of a potentially problematic opioid prescription required evidence of at least two incidents of the problematic practice. Having any indicators of a problematic prescription required evidence of at least 2 incidents of the 5 listed indicators. The population included in this study had at least one opioid prescription. The difference in percentages between 2005 and 2015 was statistically significant (p<.001) for all indicators, except receipt of a high-dose opioid among the 18- to 24-, 25- to 34-, 35- to 44-, and 45- to 54-year age groups and opioid overlap among the 25- to 34-year age group. Source: IBM MarketScan Commercial Claims and Encounters data, 2005–2015. LA/ER, long-acting or extended release; BZD, benzodiazepine.
In Figure 3, the results for those with private insurance are stratified by sex. With the exception of high-dose opioids and long-acting opioids, the rates were higher for females. In contrast, for those with Medicaid, the prevalence of almost all indicators of potentially problematic prescription was lower for females than for males (Figure 4).
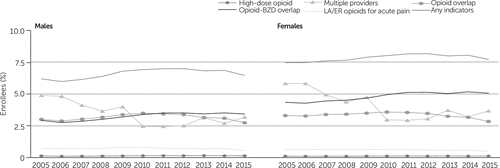
FIGURE 3. Indicators of potentially problematic opioid prescriptions among privately insured enrollees, 2005–2015, by sexa
aIndicators of a potentially problematic opioid prescription required evidence of at least two incidents of the problematic practice. Having any indicators of a problematic prescription required evidence of at least 2 incidents of the 5 listed indicators. The population included in this study had at least one opioid prescription. The difference in percentages between 2005 and 2015 was statistically significant (p<.001) for all indicators, although the difference was slightly less significant (p<.01) for receipt of a high-dose opioid among females. Source: IBM MarketScan Commercial Claims and Encounters data, 2005–2015. LA/ER, long-acting or extended release; BZD, benzodiazepine.
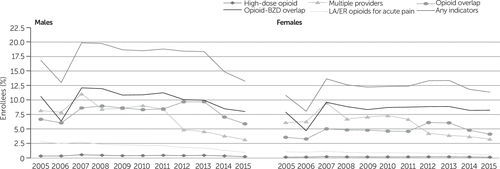
FIGURE 4. Indicators of potentially problematic opioid prescriptions among Medicaid enrollees, 2005–2015, by sexa
aIndicators of a potentially problematic opioid prescription required evidence of at least two incidents of the problematic practice. Having any indicators of a problematic prescription required evidence of at least 2 incidents of the 5 listed indicators. The population included in this study had at least one opioid prescription. The difference in percentages between 2005 and 2015 was statistically significant (p<.001) for all indicators, except receipt of a high-dose opioid among females. Source: IBM MarketScan Multi-State Medicaid data, 2005–2015 (states included varied by year). LA/ER, long-acting or extended release; BZD, benzodiazepine.
Results for Medicaid beneficiaries stratified by race are presented in Figure 5. The prevalence of all indicators of potentially problematic opioid prescription was higher among non-Hispanic whites than among African Americans and Hispanics.

FIGURE 5. Indicators of potentially problematic opioid prescriptions among Medicaid enrollees, 2005–2015, by race-ethnicitya
aIndicators of a potentially problematic opioid prescription required evidence of at least two incidents of the problematic practice. Having any indicators of a problematic prescription required evidence of at least 2 incidents of the 5 listed indicators. The population included in this study had at least one opioid prescription. The difference in percentages between 2005 and 2015 was statistically significant (p<.001) for all indicators,, except receipt of a high-dose opioid, opioid overlap, and opioid-benzodiazepine overlap among Hispanics. Source: IBM MarketScan Multi-State Medicaid data, 2005–2015 (states included varied by year). LA/ER, long-acting or extended release; BZD, benzodiazepine.
Individuals enrolled in a high-deductible health plan under private insurance had a lower prevalence of potentially problematic opioid prescription indicators compared with those enrolled in a health maintenance organization (HMO) or a preferred provider organization (PPO) (see Figure A2 in the online supplement). However, many more individuals enrolled in a high-deductible health plan had multiple providers in 2005–2007 compared with HMO and PPO enrollees. Individuals enrolled in PPO plans under Medicaid had a higher prevalence of potentially problematic opioid prescription indicators compared with those enrolled in an HMO Medicaid plan (see Figure A3 in the online supplement).
Discussion
Consistent with prior literature (25, 26), we found that one in 13 enrollees in private insurance and one in seven Medicaid enrollees who were prescribed opioids had at least two indicators of potentially problematic prescriptions that deviated from guidelines. There is a variety of possible explanations for this finding. Medicaid beneficiaries may use different physicians or settings for their care, or they may seek or receive opioids for somewhat different reasons. However, across the decade, potentially problematic prescriptions declined over time and declined more steeply among Medicaid enrollees than among those with private insurance. There was greater room for improvement at the beginning of the study as well as actual improvements in care by 2015, demonstrating that some of these practices may have reduced certain types of problematic prescriptions through policy, educational, or clinical interventions. Our results also revealed variation in rates of problematic opioid prescription by age, sex, health plan type, and race or ethnicity (33).
Prescriptions for high-dose opioids remained low and relatively stable across the study period for both payer groups, suggesting that prescribers are exercising caution regarding the prescribing of opioids with a high-morphine-milligram-equivalent. The incidence of this practice may be lower than for other prescription practices because of the greater risk of adverse events, including medication side effects (e.g., constipation, drowsiness, nausea, and vomiting) as well as overdose. Some prescription practices were more common at the beginning of the study, including the rate of receiving long-acting opioid prescription for acute pain, but decreased for both Medicaid and privately insured populations. This demonstrates an appropriate move away from long-acting opioids, which are more commonly reserved for chronic pain rather than for acute pain. By contrast, overlapping prescriptions, both for two or more opioids and for opioids and benzodiazepines, was a persistent concern across the study period, with some decline in 2014 and 2015, particularly for opioid overlap prescriptions. Prescribing of high-dose opioids over long periods of time, use of long-acting opioids for acute pain, and overlapping prescriptions are indicators that are potentially within the control of prescribers and can be influenced by public policy initiatives. For example, from August 2016, the U.S. Food and Drug Administration began to require a black box warning label on opioids regarding the dangers associated with concurrent use with benzodiazepines, and an important direction for future research will be investigation of its effect (34).
The role of patients in potentially problematic prescriptions also was evident in our study. Approximately 5% of privately insured enrollees and 8% of Medicaid enrollees obtained opioids from three or more providers. Opioid seeking from multiple providers is hard to monitor without access to a prescription drug monitoring program (PDMP). Recent literature has shown evidence of a decline in doctor shopping behavior in states where mandatory enrollment in and access to PDMPs are implemented (35). This finding highlights the importance of PDMPs in preventing potentially problematic opioid misuse.
The differences in rates of problematic opioid prescription behavior across demographic characteristics (especially among Medicaid enrollees) highlight the potential for more targeted interventions and outreach efforts. Recent research has shown an increase in mortality among low-income, middle-aged non-Hispanic whites, largely related to drug overdose, and our results showing a higher prevalence of problematic opioid prescriptions among this demographic group underscores the urgency of addressing this issue (36).
Our results should be interpreted in light of four limitations. First, we could not directly attribute prescription fills to a specific provider. We linked fills to the provider associated with the most recent relevant encounter. There are many reasons that patients with certain medical needs—particularly older patients—might see multiple providers, often within a short period of time. Not being able to link providers with prescriptions directly is most likely to affect our results regarding the use of multiple prescribers, with the likely effect of overestimating the number and percentage of patients actually obtaining opioids from more than one health care provider. Second, MarketScan includes only adjudicated pharmacy claims instead of actual drug consumption, meaning that there may be more prescription fills than our study revealed (e.g., prescriptions filled where the patient paid with cash), potentially underestimating opioid prescriptions filled. There also may have been fills that were prescribed but were not consumed. Third, this study used only data from private and Medicaid claims, excluding Medicare enrollees, the uninsured, and other payers. Patients who are uninsured are less likely to have adequate medication management, and patients with Medicare are more likely to have multiple health conditions, which may require opioid analgesics. Therefore, a potential implication of this limitation (along with our continuous enrollment requirement, which might exclude at-risk Medicaid patients) is that the rates of inappropriate prescribing reported in this study may be an underestimate. Fourth, other indicators of potentially problematic prescriptions cannot be captured with claims data (e.g., whether the physician reviewed the PDMP when starting opioid therapy and periodically thereafter if opioid therapy continued). Analysis of additional indicators with alternative data sources might be an important area for future work.
Conclusions
Recent literature shows that prescribing of opioids has decreased over the past few years (37), yet concerns about prescription practices remain. This study shows that indicators of problematic opioid prescriptions remained steady for much of the time period examined but, in some cases, decreased at the end of the study period.
Various policy approaches for limiting problematic opioid prescriptions are ongoing, at both the federal and state levels, but there is still room to expand implementation. Expanding access to PDMPs, which have been documented to reduce opioid related outcomes (35), and ensuring they have key features that facilitate their use may, in particular, help reduce the number of potentially problematic prescriptions. The 21st Century Cures Act authorized funding for states to deliver a comprehensive approach to expanding opioid use disorder prevention, treatment, and recovery support services, and these activities might play a critical role in combating the opioid crisis (38).
1 : A flood of opioids, a rising tide of deaths. N Engl J Med 2010; 363:1981–1985Crossref, Medline, Google Scholar
2 Rates of Nonmedical Prescription Opioid Use and Opioid Use Disorder Double in 10 Years. Rockville, MD, National Institute on Alcohol Abuse and Alcoholism, June 22, 2016. https://www.niaaa.nih.gov/news-events/news-releases/rates-nonmedical-prescription-opioid-use-and-opioid-use-disorder-double-10Google Scholar
3 Key Substance Use and Mental Health Indicators in the United States: Results From the 2015 National Survey on Drug Use and Health. Pub no SMA 16-4984. Rockville, MD, Center for Behavioral Health Statistics and Quality, 2016. https://www.samhsa.gov/data/sites/default/files/NSDUH-FFR1-2015/NSDUH-FFR1-2015/NSDUH-FFR1-2015.pdfGoogle Scholar
4 : The economic impact of opioid abuse, dependence, and misuse. Am J Pharm Benefits 2011; 3:e59–e70Google Scholar
5 : Societal costs of prescription opioid abuse, dependence, and misuse in the United States. Pain Med 2011; 12:657–667Crossref, Medline, Google Scholar
6 : The economic burden of prescription opioid overdose, abuse, and dependence in the United States, 2013. Med Care 2016; 54:901–906Crossref, Medline, Google Scholar
7 : Trends in opioid analgesic abuse and mortality in the United States. N Engl J Med 2015; 372:241–248Crossref, Medline, Google Scholar
8 Highlights of the 2009 Drug Abuse Warning Network (DAWN) Findings on Drug-Related Emergency Department Visits: the DAWN Report. Rockville, MD, Substance Abuse and Mental Health Services Administration, 2010Google Scholar
9 : Hospitalizations for poisoning by prescription opioids, sedatives, and tranquilizers. Am J Prev Med 2010; 38:517–524Crossref, Medline, Google Scholar
10 : Relationship between nonmedical prescription-opioid use and heroin use. N Engl J Med 2016; 374:154–163Crossref, Medline, Google Scholar
11 : Heroin use and heroin use risk behaviors among nonmedical users of prescription opioid pain relievers: United States, 2002–2004 and 2008–2010. Drug Alcohol Depend 2013; 132:95–100Crossref, Medline, Google Scholar
12 Wide-Ranging Online Data for Epidemiologic Research (WONDER). Atlanta, Centers for Disease Control and Prevention, National Center for Health Statistics, 2016. http://wonder.cdc.govGoogle Scholar
13 Prescription Opioid Overdose Data. Atlanta, Centers for Disease Control and Prevention, 2016. https://www.cdc.gov/drugoverdose/data/overdose.htmlGoogle Scholar
14 Results From the 2009 National Survey on Drug Use and Health: Volume I: Summary of National Findings. Pub no SMA 10-4586. Rockville, MD, Substance Abuse and Mental Health Services Administration, Office of Applied Studies, 2011. http://www.samhsa.gov/data/2k9/2k9Resultsweb/web/2k9results.pdfGoogle Scholar
15 : Opioid prescriptions for chronic pain and overdose: a cohort study. Ann Intern Med 2010; 152:85–92Crossref, Medline, Google Scholar
16 : De facto long-term opioid therapy for noncancer pain. Clin J Pain 2008; 24:521–527Crossref, Medline, Google Scholar
17 : Benzodiazepine prescribing patterns and deaths from drug overdose among U.S. veterans receiving opioid analgesics: case-cohort study. BMJ 2015; 350:h2698Crossref, Medline, Google Scholar
18 : Opioid analgesic and benzodiazepine prescribing among Medicaid-enrollees with opioid use disorders: the influence of provider communities. J Addict Dis 2017; 36:14–22Crossref, Medline, Google Scholar
19 : Benzodiazepines: a major component in unintentional prescription drug overdoses with opioid analgesics. J Pharm Pract 2014; 27:5–16Crossref, Medline, Google Scholar
20 : Prevalence and determinants of pharmacy shopping behaviour. J Clin Pharm Ther 2008; 33:17–23Crossref, Medline, Google Scholar
21 : Doctor and pharmacy shopping for controlled substances. Med Care 2012; 50:494–500Crossref, Medline, Google Scholar
22 : Clinical characteristics of veterans prescribed high doses of opioid medications for chronic non-cancer pain. Pain 2010; 151:625–632Crossref, Medline, Google Scholar
23 : Association between opioid prescribing patterns and opioid overdose-related deaths. JAMA 2011; 305:1315–1321Crossref, Medline, Google Scholar
24 : Analytic models to identify patients at risk for prescription opioid abuse. Am J Manag Care 2009; 15:897–906Medline, Google Scholar
25 : Potential misuse and inappropriate prescription practices involving opioid analgesics. Am J Manag Care 2013; 19:648–658Medline, Google Scholar
26 : Opioid prescribing in emergency departments: the prevalence of potentially inappropriate prescribing and misuse. Med Care 2013; 51:646–653Crossref, Medline, Google Scholar
27 : Prescription practices involving opioid analgesics among Americans with Medicaid, 2010. J Health Care Poor Underserved 2015; 26:182–198Crossref, Medline, Google Scholar
28 : Trends in use of opioids by noncancer pain type 2000-2005 among Arkansas Medicaid and HealthCore enrollees: results from the TROUP study. J Pain 2008; 9:1026–1035Crossref, Medline, Google Scholar
29 : CDC guideline for prescribing opioids for chronic pain: United States, 2016. JAMA 2016; 315:1624–1645Crossref, Medline, Google Scholar
30 : Clinical guidelines for the use of chronic opioid therapy in chronic noncancer pain. J Pain 2009; 10:113–130Crossref, Medline, Google Scholar
31 Opioid Morphine Equivalent Conversion Factors. Atlanta, Centers for Disease Control and Prevention, 2014. https://www.cms.gov/Medicare/Prescription-Drug-Coverage/PrescriptionDrugCovContra/Downloads/Opioid-Morphine-EQ-Conversion-Factors-March-2015.pdfGoogle Scholar
32 HCUP Chronic Condition Indicator: Healthcare Cost and Utilization Project (HCUP). Rockville, MD, Agency for Healthcare Research and Quality, 2016. www.hcup-us.ahrq.gov/toolssoftware/chronic/chronic.jspGoogle Scholar
33 : Factors predicting development of opioid use disorders among individuals who receive an initial opioid prescription: mathematical modeling using a database of commercially-insured individuals. Drug Alcohol Depend 2014; 138:202–208Crossref, Medline, Google Scholar
34 : Polydrug abuse: a review of opioid and benzodiazepine combination use. Drug Alcohol Depend 2012; 125:8–18Crossref, Medline, Google Scholar
35 : Prescription drug monitoring programs, nonmedical use of prescription drugs, and heroin use: Evidence from the National Survey of Drug Use and Health. Addict Behav 2017; 69:65–77Crossref, Medline, Google Scholar
36 : Rising morbidity and mortality in midlife among white non-Hispanic Americans in the 21st century. Proc Natl Acad Sci USA 2015; 112:15078–15083Crossref, Medline, Google Scholar
37 : Vital signs: changes in opioid prescribing in the United States, 2006–2015. MMWR Morb Mortal Wkly Rep 2017; 66:697–704Crossref, Medline, Google Scholar
38 : Prescriptions filled following an opioid-related hospitalization. Psychiatr Serv 2017; 68:423–424Link, Google Scholar

