Mental Health and Substance Use Disorder Spending in the Department of Veterans Affairs, Fiscal Years 2000–2007
Abstract
Objective:
This study analyzed spending for treatment of mental health and substance use disorders in the Department of Veterans Affairs (VA) in fiscal years (FYs) 2000 through 2007.
Methods:
VA spending as reported in the VA Decision Support System was linked to patient utilization data as reported in the Patient Treatment Files, the National Patient Care Database, and the VA Fee Basis files. All care and costs from FY 2000 to FY 2007 were analyzed.
Results:
Over the study period the number of veterans treated at the VA increased from 3.7 million to over 5.1 million (an average increase of 4.9% per year), and costs increased .7% per person per year. For mental health and substance use disorder treatment, the volume of inpatient care decreased markedly, residential care increased, and spending decreased on average 2% per year (from $668 in FY 2000 to $578 per person in FY 2007). FY 2007 saw large increases in mental health spending, bucking the trend from FY 2000 through FY 2006.
Conclusions:
VA's continued emphasis on outpatient and residential care was evident through 2007. This trend in spending might be unimpressive if VA were enrolling healthier Veterans, but the opposite seems to be true: over this time period the prevalence of most chronic conditions, including depression and posttraumatic stress disorder, increased. VA spending on mental health care grew rapidly in 2007, and given current military activities, this trend is likely to increase. (Psychiatric Services 62:389–395, 2011)
Per capita mental health spending in the United States was relatively stable between 1996 and 2000 (1). However, between 2000 and 2006, per capita spending increased from $104.25 to $148.56, which Frank and colleagues (1) attributed to the increased use of prescription drugs. They also found that spending on mental health varied considerably by payer. In Medicaid, mental health spending grew more slowly than spending for overall health care, whereas in private insurance the opposite was true: growth in mental health spending outpaced overall spending.
Frank and colleagues (1) did not include the Department of Veterans Affairs (VA) in their analyses, and there are a number of features that make VA an interesting case study. First, VA is one of the nation's largest integrated health care providers, with 153 medical centers, 232 vet centers, more than 800 community-based outpatient clinics, and 135 nursing homes (2), and veterans can access a wide range of services for mental health and substance use disorders. Second, the benefits are generous, and approximately two-thirds of veterans who use the VA each year receive free services because they have a service-connected disability or have passed an income-based means test. Thus the majority of veterans do not face financial barriers to care, and the VA has become an essential part of the safety net (3). Third, the VA does not use carve-outs, which are frequently used by insurers to manage mental health spending (1). Instead, all providers are employees of the VA, and they provide care in VA facilities. Finally, the VA has to provide these services within a capitated global annual budget set by the U.S. Congress.
Several studies have analyzed VA spending on treatment for mental health and substance use disorders since the mid-1990s, when the VA was reorganized into Veterans Integrated Service Networks (VISNs) that focused on access and primary care. In just four years, the VA was transformed from a system of hospitals providing inpatient care to an expanded system of hospitals and clinics emphasizing outpatient services, with no adverse effect on mortality (4). In mental health, the use of inpatient care declined dramatically, from 3.5 million bed-days in 1995 to 1.5 million bed-days in 2001. In turn, outpatient care increased, as did mental health pharmacy spending (5). The effects were similar, if not larger, for substance use disorder treatment. Inpatient spending for substance use disorder treatment declined from $442 million in 1993 to $86 million in 1999 (1999 dollars) (6). Spending for outpatient treatment of substance use disorders increased but at a slower pace than the cuts to inpatient spending, such that the net effect was a decline in the average per capita amount spent on substance use disorder treatment from $221 to $103 over this seven-year period. Some inpatient wards were converted to outpatient clinics or to psychosocial residential care programs. These residential programs grew rapidly after 1995 (5), and they enabled the VA to provide mental health and substance use disorder care to more veterans without increasing total costs (7).
Since 2001, little information has been reported on VA mental health and substance use disorder spending, a period for which Frank and colleagues (1) reported the largest growth in mental health spending per capita in the non-VA population. There has also been considerable discussion about the mental health of soldiers deployed to Operation Enduring Freedom (Afghanistan) and Operation Iraqi Freedom (OEF-OIF) (8,9). Early evidence suggests that a quarter of returning soldiers have a mental disorder diagnosis and that approximately half of those with any diagnosis have more than one (10). Common diagnoses include posttraumatic stress disorder (PTSD), anxiety, depression, and substance use disorders (10,11).
In this article, we describe VA spending on mental health and substance use disorder treatment for fiscal years (FYs) 2000 through 2007—a period during which the VA had a large increase in users.
Methods
The VA collects cost and service utilization data in several large systemwide databases. Previously the VA used the VA Cost Distribution Report (CDR) for financial accounting (5,6). In the late 1990s, the VA replaced the CDR with a new activity-based accounting system, the Decision Support System (DSS), and then stopped producing the CDR. In this study, we summarized the DSS inpatient and outpatient utilization data along with the outpatient pharmacy data to estimate spending per fiscal year. We identified mental health and substance use disorder care by using the outpatient clinic stop and the inpatient “treating specialty,” which are described in more detail elsewhere (12–14). A table of the specific clinic codes is available upon request. It should be noted that mental health treatment that is provided outside specialty mental health clinics—for example, in primary care—is not captured in these analyses.
We tabulated total costs, service utilization, and cost per VA user for FYs 2000–2007. The data give a complete picture of care provided by the VA. Because some care is provided in the community under contract and paid for by the VA, we tabulated these contract costs from the VA Fee Basis files, according to the year that the funding was disbursed. We did not include service utilization from the Fee Basis files because it was less clear when the care was provided. This means that total costs are accurate but that the reports of the volume of care are underestimated. We report expenditures in 2007 dollars and inflate expenditures for prior years using the general consumer price index report (15). We also report total outpatient pharmacy costs, and in a subanalysis using Smith and Chen's (16) methods, we identified costs related to common classes of psychiatric drugs: antipsychotics, antidepressants, anxiolytics and sedatives-hypnotics, and lithium (a list of the VA drug classes is available upon request).
Comparing spending across years implicitly assumes that patient case mix is stable. To test this assumption, we tabulated the prevalence of 56 chronic illnesses for each year of data using the Agency for Healthcare Research and Quality's Clinical Classification Software that was modified for the VA (17–19). We standardized the prevalence per 100,000 VA users. All research activities were approved by the Stanford University Institutional Review Board.
Results
Total health care spending
The VA spent $22.4 billion on health care services in FY 2000 and $33.1 billion in FY 2007, an average increase over that time of 5.7% per year (all in 2007 dollars) (Table 1). Annual increases exceeded 6% between FY 2000 and FY 2004, slowed for 2005 and 2006, and then increased again in 2007. These totals include all health services provided by the VA and care provided by contractors.
Expenditures for specialized mental health care increased from $2.1 billion in FY 2000 to $2.6 billion in FY 2007 (a 3.4% increase per year). As noted above, this total does not include mental health care provided in general medicine clinics. Outpatient specialty services grew from $910.8 million in FY 2000 to $1,385.5 million in FY 2007. Although smaller in magnitude, there were also notable increases in spending for residential care. Inpatient mental health spending was largely unchanged between FY 2000 and FY 2006, and then increased in FY 2007 (Table 1).
Spending on residential treatment of veterans with substance use disorders increased over the eight years, from $49.8 million in FY 2000 to $71.2 million in FY 2007—a 5.2% per year increase. However, spending on inpatient treatment for substance use disorders declined 5.1% per year, and spending on outpatient treatment declined an average of .6% per year. By FY 2007, VA spent approximately equal amounts on inpatient and residential care for veterans with substance use disorders.
Overall, outpatient pharmacy spending increased 60.2% from FY 2000 to FY 2007, totaling $4.7 billion in FY 2007. Spending on medications for mental health care increased from an estimated $359.0 million in FY 2000 to $535.4 million in FY 2007, a 5.9% per year increase. Finally, Table 1 presents data on overall spending for homeless veterans in the domiciliaries, which increased 6.7% per year—from $260.4 million in FY 2000 to $409.7 million in FY 2007.
Spending per veteran user
The increase in VA health care spending mirrored an increase in the number of veterans served by the VA. Overall, the VA provided care to 4.9% more veterans each year, and by FY 2007, it served 40.2% more veterans than it did in FY 2000 (5.1 million compared with 3.7 million) (Table 2). Consequently, average spending for all health care increased a very modest .7% per year per veteran. Pharmacy spending for general medical conditions increased 7.1% per year per veteran.
Spending on mental health and substance use disorder treatment per veteran declined from FY 2000 to FY 2006 and then increased notably in FY 2007 (Table 2). Despite the large increase in FY 2007, average per capita mental health spending declined an average of 1.5% per veteran per year and substance use disorder spending declined 5.5% per veteran per year, whereas mental health pharmacy spending increased on average 5.9% per year.
Figure 1 shows how average mental health and substance use disorder spending per veteran changed between FY 2000 and FY 2007. Mental health and substance use disorder spending decreased over time, except for FY 2007. In comparison, spending on medications increased rapidly between FY 2000 and FY 2004, and then the growth in spending leveled off. This was true for all medications and for mental health medications.
Volume of care
As shown in Table 3, the mix of mental health and substance use disorder care changed between FY 2000 and FY 2007, with a notable decline in inpatient care. Specialized mental health inpatient bed-days decreased from 1.68 million in FY 2000 to 1.23 million in FY 2007. Similarly, inpatient substance use disorder bed-days declined from 203,000 in FY 2000 to 138,000 in FY 2007 (a decline of 5.4% per year). While inpatient care declined, VA provided slightly more bed-days in residential care. For specialized mental health care, the number of residential bed-days increased on average 1.9% per year, while bed-days for residential care for substance use disorders increased .6% per year. Growth of services was also seen in outpatient mental health care, which increased from 6.7 million visits in FY 2000 to 8.3 million visits in FY 2007. However, outpatient care for substance use disorders declined during this period, from 2.6 million visits in FY 2000 to 1.9 million visits in FY 2007, an average 4.3% decline per year.
Veterans' health conditions
Of the chronic conditions we tracked to monitor changes in case mix, hypertension was the most prevalent each year. In FY 2007 it was present for 52,847 veterans per 100,000. Table 4 shows the top five chronic conditions, along with prevalence data on diagnoses of mental and substance use disorders. All five of the most diagnosed conditions increased in prevalence from FY 2000 to FY 2007. Depression was the sixth most prevalent chronic condition, and its prevalence also increased at an average of 3.8% per year. The prevalence of PTSD increased quite quickly, at 6.4% per year, while the prevalence of schizophrenia declined at 7.2% per year.
Discussion
The number of veterans who used VA health care grew 40.2%, from 3.65 million in FY 2000 to 5.12 million in FY 2007 (4.9% per year), and overall spending increased 5.7% per year, but average total health care spending per veteran increased only .7% per year. These findings are considerably lower than national per capita annual growth estimates from Catlin and colleagues (20), which were greater than 5% per person for the same time period.
Mental health and substance use disorder spending by the VA did not keep pace with overall health care spending. This is most evident in the average per capita spending, which decreased from $668 in FY 2000 to $534 in FY 2006. FY 2007 bucked the trends in prior years with 8.1% and 8.6% increases in mental health and substance use disorder spending, respectively. These increases may be a result of the large proportion of veterans with mental health needs returning from OEF-OIF (10,21,22), because the number of veterans with depression and PTSD grew substantially over this time. These changes could also be responses to the Uniform Mental Health Services Act, which was enacted in 2006 to ensure that all veterans, regardless of where they receive care, have access to mental health services (including substance use disorder treatment) at VA hospitals and community-based outpatient clinics. According to internal VA data, full-time-equivalent mental health staff grew by 8% from 2005 to 2007; the growth was led by therapists (26% increase), followed by social workers (21%), psychologists (13%), physicians (5%), and nurses (<1%). We could not identify staffing data before 2005 to determine whether the staffing was relatively stable in the earlier years. Finally, costs may have increased in response to changes in the regional distribution of the veteran population or in provider efficiency, but such analyses were beyond the scope of this study.
The VA's mental health spending resembles Medicaid's spending as reported by Frank and colleagues (1). While private insurers experienced overall increases in spending on prescription drugs, Medicaid and VA saw smaller increases in spending for prescription drugs for mental health conditions. In the VA, spending on pharmaceuticals, both overall and for mental health medications, increased between FY 2000 and FY 2004 and then leveled off. It is not clear what caused this leveling off. One explanation is that the demand may have changed for Medicare-eligible veterans with the implementation of Medicare Part D in January 2006, but this would not explain why VA prescription spending slowed between FY 2004 and FY 2005. Demand could also reflect changes in the case mix of veterans with mental health conditions. The prevalence of schizophrenia decreased from 3,048 (per 100,000 veteran users) in FY 2000 to 1,809 in FY 2007 (an average decrease of 7.2% per year). In contrast, the prevalence of depression, which is less complex to manage, grew 3.8% per year from 10,950 (per 100,000 Veteran users) to 14,187, not including care provided in primary care clinics for patients with depression. However, the changes in case mix seem an unlikely explanation, because further examination shows that the prevalence of schizophrenia decreased more rapidly between FY 2000 and FY 2004, when drug spending was increasing.
A third explanation is that this leveling off could reflect the VA's ability to manage care. The VA uses a national formulary and encourages use of generics when possible. The VA Pharmacy Benefits Management Services provides guidance for managing depression and for using second-generation antipsychotics for schizophrenia. In the latter case, the physician is encouraged to identify an effective therapy for the patient, and if there is more than one equivalent option, the physician is directed to consider the less expensive agent. It is not clear whether clinicians use these recommendations when prescribing second-generation antipsychotics for patients with schizophrenia or in situations outside of the document's primary aim (for example, in treating depression). Although a number of generic medications became available around the time that spending leveled off (for example, citalopram), other common medications (for example, fluoxetine) were available as generics in earlier years, when the spending was increasing more rapidly. Therefore, with the data presented here, we do not have an explanation for why spending grew rapidly from FY 2000 and then leveled off. Further research would be needed to isolate the likely mechanisms.
This study has a number of important limitations. The VA, like other health care systems, is increasingly relying on primary care providers to offer a broad portfolio of services. Our data show the cost and services provided in specialized mental health clinics. This report also highlights the cost of drugs commonly used in psychiatric outpatient care, but the data do not include any health care services provided in primary care or general medical clinics. For example, if a veteran talked to his or her primary care doctor about a mental health concern or side effects related to a mental health medication that did not translate into a new prescription, then these consultations would be missing from our cost estimates. The spending estimates for mental health medications are also imperfect because we excluded some mental health drugs that are frequently used in non-mental health indications. Therefore, the figures for mental health spending, per se, should be viewed as conservative estimates.
Although it might be tempting to suggest, for the same reasons, that our estimates are conservative with regard to substance use disorder treatment (that is, an underestimation of the amount of substance use disorder services provided in the VA), recent research has shown that VA primary care providers are not providing substance use disorder services (23). Thus, as the nation's largest provider of substance use disorder treatment, this contraction could indicate that fewer veterans with a substance use disorder are seeking care in the VA or that more veterans are paying out of pocket, are looking to other insurers to cover their costs, or are not getting needed care. Using data from 2003 and 2004, Petersen and colleagues (24) found that 80% of veterans under age 65 relied on VA for mental health and substance use disorder care; reliance on VA decreased to 55% for veterans over age 65 because of Medicare. Unfortunately, there are no data from more recent years to determine whether veterans are becoming more or less reliant on VA services.
One trend worth following is VA's payments to community providers (that is, contract care). Between FY 2000 and FY 2007, spending on contract care grew rapidly at 18.3% per year. Although such growth is likely to improve access to care for veterans who live in rural areas, it is not clear how providers are managing care across multiple systems, especially when most providers do not use an electronic medical record (25,26). A recent study found that contract care was frequently used for emergency care or treatment that requires recurrent visits to a clinic (for example, dialysis and physical rehabilitation) (27), while veterans received most (88%) of their outpatient psychiatric care and almost all of their alcohol and drug treatment at VA facilities. Use of contract providers could also have implications for outcomes, but like Frank and colleagues (1), we have not linked the spending data to outcomes. Therefore, we cannot make statements about whether the additional (or decreased) spending was associated with marginal benefits.
Conclusions
Undoubtedly, some might look at trends in VA spending and decry the lack of increases in mental health and substance use disorder treatment. However, another perspective on these data is that the VA treated a growing population of chronically ill veterans while holding spending in check (.7% per person per year). The savings were correlated with decreases in inpatient care, an increase in outpatient mental health visits, and a decrease in outpatient substance use disorder visits.
1 : Trends in mental health cost growth: an expanded role for management? Health Affairs 28:649–659, 2009 Crossref, Google Scholar
2 Facts About the Department of Veterans Affairs. Washington, DC, Department of Veterans Affairs, Jan 2009. Available at www1.va.gov/opa/publications/factsheets/fs_department_of_veterans_affairs.pdf Google Scholar
3 : The VA health care system: an unrecognized national safety net. Health Affairs 16(4):200–204, 1997 Crossref, Google Scholar
4 : Hospital use and survival among Veterans Affairs beneficiaries. New England Journal of Medicine 349:1637–1646, 2003 Crossref, Medline, Google Scholar
5 : Spending for specialized mental health treatment in the VA: 1995–2001. Health Affairs 22(6):256–263, 2003 Crossref, Google Scholar
6 : The effect of reforms on spending for veterans' substance abuse treatment, 1993–1999. Health Affairs 20(4):169–175, 2001 Crossref, Google Scholar
7 : An economic evaluation of inpatient residential treatment programs in the Department of Veterans Affairs. Medical Care Research and Review 62:187–204, 2005 Crossref, Medline, Google Scholar
8 : Risk of suicide among US veterans after returning from the Iraq or Afghanistan war zones. JAMA 300:652–653, 2008 Crossref, Medline, Google Scholar
9 (eds): Invisible Wounds of War: Psychological and Cognitive Injuries, Their Consequences, and Services to Assist Recovery. Santa Monica, Calif, RAND, 2008Google Scholar
10 : Bringing the war back home: mental health disorders among 103,788 US veterans returning from Iraq and Afghanistan seen at Department of Veterans Affairs facilities. Archives of Internal Medicine 167:476–482, 2007 Crossref, Medline, Google Scholar
11 : Health and exposure concerns of veterans deployed to Iraq and Afghanistan. Journal of Occupational and Environmental Medicine 49:475–480, 2007 Crossref, Medline, Google Scholar
12 : Using average cost methods to estimate encounter-level costs for medical-surgical stays in the VA. Medical Care Research and Review 60(suppl 3):15S–36S, 2003 Crossref, Medline, Google Scholar
13 : Average cost of VA rehabilitation, mental health, and long-term hospital stays. Medical Care Research and Review 60(suppl 3):40S–53S, 2003 Crossref, Medline, Google Scholar
14 : Estimating the costs of VA ambulatory care. Medical Care Research and Review 60(suppl 3):54S–73S, 2003 Crossref, Medline, Google Scholar
15 Consumer Price Index. Washington, DC, Department of Labor, Bureau of Labor Statistics, 2006. Available at ftp.bls.gov/pub/special.requests/cpi/cpiai.txt Google Scholar
16 : Current trends in outpatient pharmacy in VA specialized mental health treatment. Psychiatric Services 55:315–317, 2004 Link, Google Scholar
17 : The relationships among age, chronic conditions, and healthcare costs. American Journal of Managed Care 10:909–916, 2004 Medline, Google Scholar
18 : Prevalence and costs of chronic conditions in the VA health care system. Medical Care Research and Review 60(suppl 3):146S–167S, 2003 Crossref, Medline, Google Scholar
19 : Gender disparities in Veterans Health Administration care: importance of accounting for veteran status. Medical Care 46:549–553, 2008 Crossref, Medline, Google Scholar
20 : National health spending in 2005: the slowdown continues. Health Affairs 26:142–153, 2007 Crossref, Google Scholar
21 : Mental health problems, use of mental health services, and attrition from military service after returning from deployment to Iraq or Afghanistan. JAMA 295:1023–1032, 2006 Crossref, Medline, Google Scholar
22 Institute of Medicine: Preliminary Assessment of Readjustment Needs of Veterans, Service Members, and Their Families. Washington, DC, National Academies Press, 2010 Google Scholar
23 : How are substance use disorders addressed in VA psychiatric and primary care settings? Results of a national survey. Psychiatric Services 58:266–269, 2007 Link, Google Scholar
24 : Relationship between clinical conditions and use of Veterans Affairs health care among Medicare-enrolled veterans. Health Services Research 45:762–791, 2010 Crossref, Medline, Google Scholar
25 : Use of electronic health records in US hospitals. New England Journal of Medicine 360:1628–1638, 2009 Crossref, Medline, Google Scholar
26 : Electronic health records in ambulatory care: a national survey of physicians. New England Journal of Medicine 359:50–60, 2008 Crossref, Medline, Google Scholar
27 Analysis for the Department of Veteran Affairs Fee Basis Program for the Office of Rural Health. Booz Allen Hamilton, Rockville, Md, 2008 Google Scholar
Figures and Tables
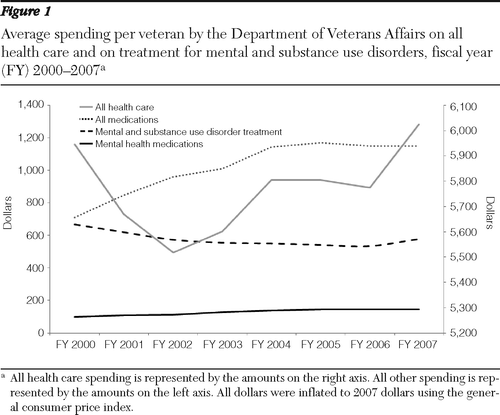
Figure 1 Average spending per veteran by the Department of Veterans Affairs on all health care and on treatment for mental and substance use disorders, fiscal year (FY) 2000–2007
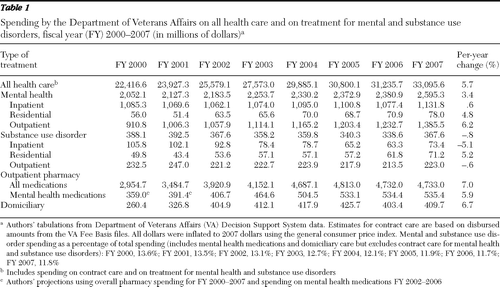
Table 1 Spending by the Department of Veterans Affairs on all health care and on treatment for mental and substance use disorders, fiscal year (FY) 2000–2007 (in millions of dollars)
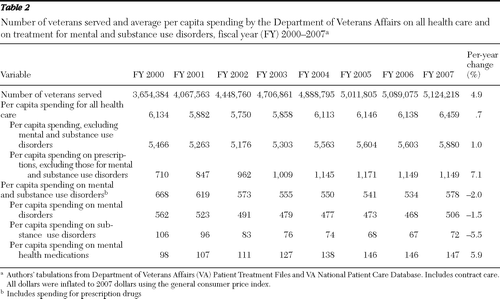
Table 2 Number of veterans served and average per capita spending by the Department of Veterans Affairs on all health care and on treatment for mental and substance use disorders, fiscal year (FY) 2000–2007
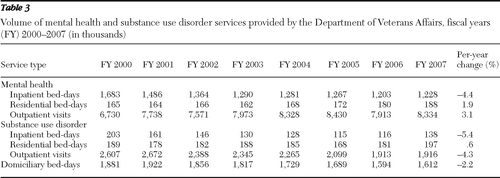
Table 3 Volume of mental health and substance use disorder services provided by the Department of Veterans Affairs, fiscal years (FY) 2000–2007 (in thousands)
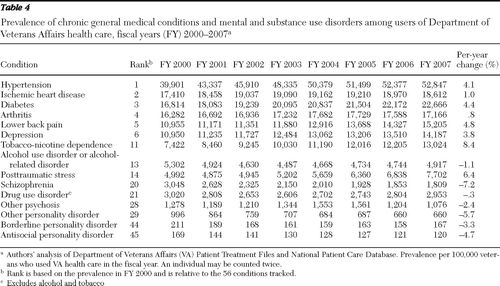
Table 4 Prevalence of chronic general medical conditions and mental and substance use disorders among users of Department of Veterans Affairs health care, fiscal years (FY) 2000–2007


