Associations Between Race and Ethnicity and Receipt of Advice About Alcohol Use in the Department of Veterans Affairs
Alcohol misuse is common and associated with considerable morbidity and mortality; approximately one-fifth of medical outpatients in the United States drink at unhealthy levels ( 1 ). A number of clinical trials have shown the value of brief counseling in decreasing alcohol consumption ( 1 , 2 , 3 ). The U.S. Preventive Services Task Force has therefore recommended routine alcohol screening and brief alcohol counseling for patients who drink above levels generally considered safe ( 4 ). In addition, the Department of Veterans Affairs (VA) has designated routine screening and providing brief counseling to veterans who misuse alcohol as a national performance measure since fiscal year (FY) 2008 ( 5 ).
Unfortunately, fewer than half of patients with alcohol misuse (those drinking above recommended limits or those with a diagnosable alcohol use disorder) ( 6 , 7 ) report receiving alcohol-related advice from their primary clinicians ( 8 , 9 , 10 , 11 ). Previous research has identified patient characteristics that are associated with alcohol-related screening and alcohol-related advice ( 9 , 11 , 12 , 13 , 14 , 15 ). These studies indicate that patients may be more likely to receive alcohol-related advice if they drink heavily or have suffered psychosocial or medical consequences as a result of their drinking or if they are male, unmarried, of lower socioeconomic status, or smokers. Several studies have also detected associations between patient race and rates of counseling for alcohol misuse ( 8 , 13 ), finding that nonwhite patients received counseling more frequently than white patients. However, other studies have not detected the same associations ( 11 ).
The objectives of the study presented here were to describe alcohol consumption across racial and ethnic groups among veterans treated in the VA system and to examine associations between race and ethnicity and receipt of alcohol-related advice from clinicians, as reported by patients.
Methods
This study was a cross-sectional analysis of data from the national VA Survey of the Health Experiences of Patients (SHEP) for FY 2005. SHEP includes questions about demographic characteristics, patient satisfaction, health status, and health behavior information, and it is mailed each month to a randomly selected sample of patients who use VA health care services. The Portland (Oregon) VA Medical Center Institutional Review Board approved this project, and the VA Office of Quality and Performance provided the deidentified data.
Sample and survey administration
All patients who saw clinicians during appointments at one of over 800 VA ambulatory care sites (unique parent facilities as well as separate clinics including community-based outpatient clinics) across the United States in FY 2005 who had not been selected for participation in SHEP within the prior 12 months were potentially eligible for being asked to participate in SHEP. The exact number of sites varies slightly each quarter on the basis of case availability and other sampling issues. Patients were randomly selected from three groups: new primary care patients, established primary care patients, and specialty care patients. Patients were selected at each site in order to ensure sufficient representation from each of these three groups. In 2005, 15 patients per group per month were randomly selected for SHEP from each site. Selected veterans were sent presurvey notification letters explaining the nature and goals of the survey and encouraging participation. One week later SHEP questionnaires were mailed. Postcards that thanked veterans for their time and reminded them to complete the survey were sent one week later. Data collection remained open for three weeks after postcards were mailed. The response rate for SHEP in FY 2005 was 59.9%; there were 262,003 respondents.
Measures
The SHEP sent in FY 2005 included all demographic variables and measures necessary for the study presented here except for age, sex, and site location; these data were obtained from VA administrative databases by the VA Office of Quality and Performance.
Demographic characteristics. To assess race and ethnicity, SHEP asked whether the respondent was of Hispanic or Latino origin or descent (yes or no) and then asked the participant to select all applicable race categories from the following: white (Caucasian); black or African American; Asian, Native Hawaiian, or Pacific Islander; and American Indian or Alaska Native. In the analyses, we categorized race and ethnicity as: Hispanic (zero or one race category selected); white (non-Hispanic); black (non-Hispanic); Asian, Native Hawaiian, or Pacific Islander (non-Hispanic); American Indian or Alaska Native (non-Hispanic); or multiple (two or more race categories selected). SHEP employment status response options were employed for wages, self-employed, unable to work, looking for work, and unemployed for more than one year, looking for work and unemployed for less than one year, homemaker, student, and retired. In analyses, employment status was categorized as employed (including employed for wages or self-employed), not employed (unemployed categories, homemaker, student, or retired), and unable to work.
SHEP marital status response options were married, divorced, separated, widowed, and never married. In analyses, these were categorized as married, previously married (divorced, separated, or widowed), or never married. Finally, SHEP respondents were asked to select the last year of school completed from the following options: did not complete high school, high school graduate or GED, some college, or college graduate or beyond. In analyses, these were categorized as less than high school, high school or GED completion or some college, or college graduate or higher.
Alcohol use and advice. Alcohol consumption was measured with the three alcohol consumption questions from the Alcohol Use Disorders Identification Test (AUDIT-C), a validated screen for alcohol misuse and for severity of misuse ( 16 , 17 ). Possible AUDIT-C scores range from 0 to 12, with higher scores indicating greater alcohol consumption, and with optimal cutoff scores for identification of alcohol misuse being ≥4 among men and ≥3 among women ( 18 , 19 ). The AUDIT-C has been validated for use among men and women and across racial and ethnic groups ( 19 ). We used AUDIT-C scores to create four alcohol consumption categories: no consumption (nondrinkers) (score, 0), low levels of consumption (score, 1–3), medium levels (score, 4–7), and high levels (score, 8–12). Survey respondents who endorsed any drinking (score, >0) were asked to complete an additional SHEP item stating, "In the past 12 months has a VA doctor or other VA health care provider advised you about your drinking (to drink less or not to drink alcohol)?" (yes or no response). The answer to this item constituted the dependent variable in our regression models.
To examine the sensitivity of our models to alternative AUDIT-C classification schemes, in secondary analyses we categorized AUDIT-C scores into four categories for persons who consumed any alcohol—low levels of consumption (score, 1–3), medium levels (score, 4–6), medium-high levels (score, 7–9), and high levels (score, 10–12). We also created models that used the AUDIT-C score as a continuous variable.
Health status. Health status was measured with the Veterans RAND 12-Item Health Survey (VR-12), a validated measure of mental and physical health status ( 20 ). The VR-12 was developed from the Veterans RAND 36-Item Health Survey (VR-36), which was developed from the 36-Item Short-Form Health Survey, Version 1 (developed by RAND as part of the Medical Outcomes Study) ( 21 ). The VR-12 generates two component scores, a physical component summary score (PCS) and a mental component summary score (MCS) ( 22 ). Possible PCS and MCS scores range from 0 to 100, where 100 denotes the best health. PCS and MCS scores were used as covariates in our analyses to adjust for independent effects of mental and physical health status on counseling rates. We included these measures as covariates because a previous study within the VA demonstrated associations between health problems and receiving alcohol counseling ( 8 ).
Analysis
Using a method developed by Spiro and colleagues ( 22 ), we used modified regression estimation to impute VR-12 PCS and MCS scores when data were missing. This resulted in 255,522 patients (97.5% of all respondents) having both PCS and MCS scores, which served as the sample for descriptive analyses. Regression models were constructed for patients who endorsed any drinking (N=135,873) and who also had complete data on demographic characteristics, AUDIT-C scores, and PCS and MCS scores (N=119,237). Rates of missing AUDIT-C scores and race or ethnicity data were approximately 5% and .7%, respectively.
All analyses were based on weighted data, with weights taking into account survey inclusion probability and differential distribution of age, sex, site volume, and clinic type. These weights are used by the VA Office of Quality and Performance to derive nationally representative estimates. Design-based F tests (which take into account survey design and sample weights) ( 23 ) were used to compare subgroups. Because of the use of sample weights in analyses, numerator degrees of freedom are not integers. Denominator degrees of freedom are not reported; all are greater than 10,000.
For our main analysis, using the sample of veterans who consumed any alcohol and who completed the item regarding receiving counseling for alcohol use, we constructed logistic regression models to characterize relationships between racial and ethnic categories and reports of receipt of counseling for alcohol use. In the first model, we included demographic variables (age, sex, education level, marital status, and employment status) and alcohol consumption category. In the second (full) model, we included the above variables and added physical and mental health status (MCS and PCS scores).
In secondary analyses, the above procedures were followed using the two alternative AUDIT-C classification schemes. We also constructed models for the sample of patients with AUDIT-C scores ≥4, because these patients are considered to have positive alcohol misuse screens ( 18 , 19 ), which is a strong indication to offer alcohol-related advice ( 4 ). Analyses were conducted using R version 2.6.1 in combination with the R "survey" package ( 24 , 25 , 26 ).
Results
Table 1 shows demographic characteristics of the overall sample and compares patients who endorsed any drinking (N=135,873) with patients who reported no drinking (N=106,625). AUDIT-C scores were missing for 13,024 patients (5.1%); these patients were excluded from these comparisons. On average, patients who endorsed any drinking were slightly younger, less likely to be married, more likely to be college graduates, and more likely to be working, and they had slightly higher MCS and PCS scores. In addition, the distribution of rates of any drinking was significantly different across race and ethnicity groups. Higher proportions of three groups—black veterans; Asian, Native Hawaiian, or Pacific Islander veterans; and American Indian or Alaska Native veterans—were represented in the nondrinking category (compared with any drinking), compared with other racial and ethnic groups (F=13.10, ndf=5.0, p<.001).
 |
Figure 1 graphically depicts the distributions of the four AUDIT-C score categories across racial and ethnic groups. Compared with other racial and ethnic groups, there were smaller proportions of Asian, Native Hawaiian, or Pacific Islander veterans in the middle and high alcohol consumption categories and there were smaller proportions of non-Hispanic white veterans in the high alcohol consumption category.
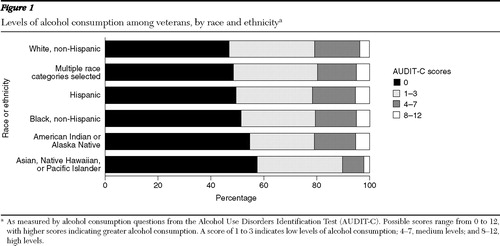
Table 2 shows rates of receipt of alcohol-related advice, demographic characteristics, and health status among patients reporting any alcohol consumption (N=135,873), according to racial and ethnic category. A total of 946 participants (.7%) were excluded because of missing information on race or ethnicity. There were a number of differences in the distributions of demographic and health status variables in this group. Overall, 28% of veterans who consumed any alcohol reported receiving alcohol-related advice. Within this group, non-Hispanic white veterans were less likely than the other racial or ethnic groups to report receiving alcohol advice (19%), whereas black veterans and American Indian or Alaska Native veterans reported the highest rates of receiving advice (34% each).
 |
Among the subsample of 54,967 respondents with AUDIT-C scores ≥4 (for whom alcohol-related advice is specifically recommended), overall, 33% reported receiving alcohol-related advice. In this subgroup, non-Hispanic white veterans (30%) were less likely than the other racial or ethnic groups to report receiving alcohol advice, whereas non-Hispanic black veterans (49%) and American Indian or Alaska Native veterans (47%) reported the highest rates of receiving alcohol advice.
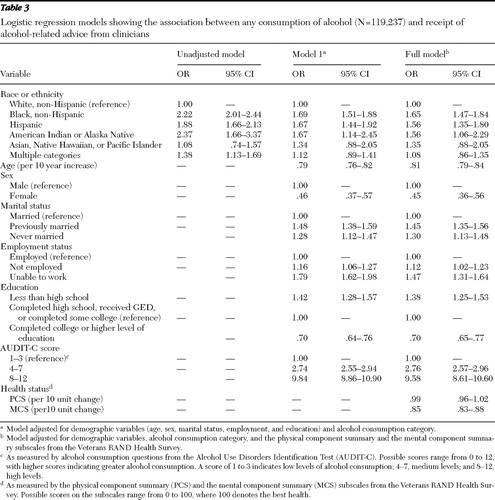
In the first regression model ( Table 3 , model 1), which adjusted for demographic variables (age, sex, marital status, employment, and education) and alcohol consumption category, veterans who were black, Hispanic, or American Indian or Alaska Native were more likely than non-Hispanic white veterans to report receiving alcohol counseling. In the second model ( Table 3 , full model), which added mental and physical health status (MCS and PCS scores) as covariates, those who were black (odds ratio [OR]=1.65), Hispanic (OR=1.56), or American Indian or Alaska Native (OR=1.56) were more likely than non-Hispanic white veterans to report receiving alcohol related advice. In the full model, receipt of alcohol counseling was also strongly associated with alcohol consumption level (AUDIT-C scores >8, OR=9.58, and AUDIT-C scores 4–7, OR=2.76) and negatively associated with female sex (OR=.45) and age (OR=.81).
 |
In secondary analyses, we constructed models for the subsample of veterans with AUDIT-C scores ≥4 (N=54,221). In the full model, which adjusted for demographic variables, alcohol consumption category, and mental and physical health status, the results were similar to those obtained using the whole sample—that is, veterans who were non-Hispanic black (OR=1.43, CI=1.23–1.66) or Hispanic (OR=1.36, CI=1.12–1.64) were more likely than non-Hispanic white veterans to report receiving alcohol-related advice. However, in this model, American Indian or Alaska Natives were not significantly more likely than non-Hispanic white veterans to report receiving alcohol-related advice (OR=1.39, CI=.83–2.31). We also tested the sensitivity of our main regression models to the two alternative AUDIT-C scoring schemes—that is, using four categories of alcohol consumption and using AUDIT-C scores as a continuous variable. Overall, the results (not shown) did not meaningfully change from those obtained in the primary analyses, which used three categories of alcohol consumption.
Discussion
We found significant differences in the distributions of alcohol consumption scores across racial and ethnic groups, with smaller proportions of Asian, Native Hawaiian, or Pacific Islanders in the medium and highest consumption categories and smaller proportions of non-Hispanic whites in the highest consumption category. Across several sets of models and AUDIT-C classification schemes, we found that among the respondents who consumed any alcohol, when the analysis adjusted for age, sex, marital status, employment status, educational attainment, physical and mental health status, and alcohol consumption category, veterans who self-identified as non-Hispanic black or Hispanic were more likely than non-Hispanic whites to report receiving alcohol-related advice from health care providers. Alcohol consumption level, age, and sex were also associated with rates of receipt of alcohol-related advice in these models.
Our findings are consistent with several previous studies. Arndt and colleagues ( 13 ) found that after the analyses adjusted for demographic characteristics and alcohol consumption (measured in drinking days), nonwhite respondents were more likely than white respondents to report having alcohol-related discussions with their physicians. Similarly, Burman and colleagues ( 8 ) reported that after adjustment for demographic characteristics, alcohol consumption, alcohol-related medical conditions (including hypertension, liver disease, and posttraumatic stress disorder), and smoking status, the odds of receiving advice to abstain from alcohol were about 40% lower for whites than for nonwhites.
The study presented here has several important limitations.Although the sample was large, it was composed largely of older men with multiple general medical problems; thus the findings may not be very generalizable to non-VA patient populations. In addition, the overall SHEP response rate was only 60%, and we were not able to conduct analyses comparing responders to nonresponders. Previous research has shown that nonresponse to alcohol consumption questionnaires may be associated with higher alcohol consumption levels ( 27 ). We note that using sample weights in the analyses allowed us to adjust for differences in nonresponse rates and demographic characteristics across sites. The low rates of missing AUDIT-C scores and data on race and ethnicity constitute a strength of this study.
Another potential limitation is that we relied on participants' self-report for most variables in the study. However, self-report is an accepted means of measurement in health research, including research on sensitive topics such as alcohol use ( 28 , 29 ). It is also possible that variation existed in the perception of what constitutes advice regarding alcohol, which, if experienced differentially across racial or ethnic groups, could influence our results. Moreover, report of receipt of alcohol-related advice might be perceived by some patients to be similar to reporting that they have an alcohol problem. Given the stigmatization of problem drinking, patients might therefore also underreport receiving alcohol-related advice; racial differences in such underreporting could exist, as has been found in studies of alcohol screening questionnaires ( 30 ). Finally, our data set did not include several potential confounders. For example, we did not include information about current smoking or specific alcohol-related medical conditions; several previous studies have found associations between these factors and receiving alcohol advice ( 8 , 11 ). On the other hand, we adjusted for other known important potential confounders, including demographic characteristics and alcohol consumption levels, as well as overall physical and mental health status.
Despite potential limitations, several issues are worth highlighting. First, previous research has shown that alcohol-related advice is given too infrequently to those who need it ( 8 , 9 , 10 , 11 , 12 ). Indeed, in our sample, less than one-third of patients who drank at all and one-third of patients with positive alcohol misuse screens reported receiving alcohol-related advice. Second, previous studies have shown that, in general, persons from racial or ethnic minority groups frequently do not receive the same level of care as whites ( 31 ). In our study, black, Hispanic, and American Indian or Alaska Native veterans received more advice than non-Hispanic white veterans, even after adjustment for sociodemographic and health status measures. This raises the possibility that racial and ethnic stereotypes may contribute to clinicians' offering alcohol-related advice more or less frequently to some racial or ethnic minority groups. Clearly, further research is needed to understand the underlying reasons for the differences we observed in rates of patient report of receiving alcohol-related advice.
Conclusions
Our results suggest that veterans from certain racial or ethnic minority groups were more likely than non-Hispanic white veterans to report receiving alcohol-related advice in the VA, after the analysis was adjusted for demographic variables, mental and physical health status, and alcohol consumption categories. We also found that, in adjusted models, women and older veterans were less likely to receive alcohol-related advice, compared with their male and younger counterparts, respectively. Further research is indicated to understand the underlying reasons for the differences we observed and the potential clinical impact of differential rates of receipt of alcohol-related advice.
Acknowledgments and disclosures
The research reported here was supported by the Department of Veterans Affairs, Veterans Health Administration, Health Services Research and Development Service Projects PMI 03-195, RCD 04129, and REA 06-174. The views expressed in this manuscript are those of the authors and do not necessarily represent the views of the Department of Veterans Affairs. The authors gratefully acknowledge the assistance that Lewis E. Kazis, Sc.D., and his research team provided in developing and sharing VR-12 scoring and imputation algorithms; Katharine A. Bradley, M.D., M.P.H., for suggestions regarding the analyses and critical review of an earlier version of this article; Jennifer Flores, M.A., for assistance with scoring and organizing data for analysis; and the VA Office of Quality and Performance for providing the data for this study.
The authors report no competing interests.
1. Room R, Babor T, Rehm J: Alcohol and public health. Lancet 365:519–530, 2005Google Scholar
2. Fleming MF, Manwell LB, Barry KL, et al: Brief physician advice for alcohol problems in older adults: a randomized community-based trial. Journal of Family Practice 48:378–384, 1999Google Scholar
3. Kaner EF, Beyer F, Dickinson HO, et al: Effectiveness of brief alcohol interventions in primary care populations. Cochrane Database of Systematic Reviews CD004148, 2007Google Scholar
4. Screening and Behavioral Counseling Interventions in Primary Care to Reduce Alcohol Misuse. Washington, DC, US Department of Health and Human Services, US Preventive Services Task Force, Apr 2004. Available at www.ahrq.gov/clinic/uspstf/uspsdrin.htm Google Scholar
5. FY 2008, Q1 Technical Manual for the VHA Performance Measurement System. Washington, DC, Veterans Health Affairs Office of Quality and Performance, 2008Google Scholar
6. Bradley KA, Williams EC, Achtmeyer CE, et al: Implementation of evidence-based alcohol screening in the Veterans Health Administration. American Journal of Managed Care 12:597–606, 2006Google Scholar
7. Bradley KA, Donovan DM, Larson EB: How much is too much? Advising patients about safe levels of alcohol consumption. Archives of Internal Medicine 153:2734–2740, 1993Google Scholar
8. Burman ML, Kivlahan D, Buchbinder M, et al: Alcohol-related advice for Veterans Affairs primary care patients: Who gets it? Who gives it? Journal of Studies on Alcohol and Drugs 65:621–630, 2004Google Scholar
9. Bradley KA, Epler AJ, Bush KR, et al: Alcohol-related discussions during general medicine appointments of male VA patients who screen positive for at-risk drinking. Journal of General Internal Medicine 17: 315–326, 2002Google Scholar
10. Conigliaro J, Lofgren RP, Hanusa BH: Screening for problem drinking: impact on physician behavior and patient drinking habits. Journal of General Internal Medicine 13:251–256, 1998Google Scholar
11. Volk RJ, Steinbauer JR, Cantor SB: Patient factors influencing variation in the use of preventive interventions for alcohol abuse by primary care physicians. Journal of Studies on Alcohol and Drugs 57:203–209, 1996Google Scholar
12. Richmond R, Kehoe L, Heather N, et al: General practitioners' promotion of healthy life styles: what patients think. Australia and New Zealand Journal of Public Health 20:195–200, 1996Google Scholar
13. Arndt S, Schultz SK, Turvey C, et al: Screening for alcoholism in the primary care setting: are we talking to the right people? Journal of Family Practice 51:41–46, 2002Google Scholar
14. Buchsbaum DG, Buchanan RG, Lawton MJ, et al: A program of screening and prompting improves short-term physician counseling of dependent and nondependent harmful drinkers. Archives of Internal Medicine 153:1573–1577, 1993Google Scholar
15. Kaner EF, Heather N, Brodie J, et al: Patient and practitioner characteristics predict brief alcohol intervention in primary care. British Journal of General Practice 51:822–827, 2001Google Scholar
16. Bush K, Kivlahan DR, McDonell MB, et al: The AUDIT alcohol consumption questions (AUDIT-C): an effective brief screening test for problem drinking: Ambulatory Care Quality Improvement Project (ACQUIP): Alcohol Use Disorders Identification Test. Archives of Internal Medicine 158:1789–1795, 1998Google Scholar
17. Bradley KA, Kivlahan DR, Zhou XH, et al: Using alcohol screening results and treatment history to assess the severity of at-risk drinking in Veterans Affairs primary care patients. Alcoholism: Experimental and Clinical Research 28:448–455, 2004Google Scholar
18. Bradley KA, Bush KR, Epler AJ, et al: Two brief alcohol-screening tests from the Alcohol Use Disorders Identification Test (AUDIT): validation in a female Veterans Affairs patient population. Archives of Internal Medicine 163:821–829, 2003Google Scholar
19. Bradley KA, DeBenedetti AF, Volk RJ, et al: AUDIT-C as a brief screen for alcohol misuse in primary care. Alcoholism: Experimental and Clinical Research 31:1208–1217, 2007Google Scholar
20. Kazis LE, Miller DR, Skinner KM, et al: Applications of methodologies of the Veterans Health Study in the VA healthcare system: conclusions and summary. Journal of Ambulatory Care Management 29:182–188, 2006Google Scholar
21. Hays RD, Sherbourne CD, Mazel RM: The RAND 36-Item Health Survey 1.0. Health Economics 2:217–227, 1993Google Scholar
22. Spiro A, Rogers W, Qian S, et al: Imputing Physical and Mental Summary Scores (PCS and MCS) for the Veterans SF-12 Health Survey in the Context of Missing Data. Baltimore, CMS, 2004Google Scholar
23. Koch G, Freedman D, Freedman J: Strategies in multivariate analysis of data from complex surveys. International Statistical Review 43:59–78, 1975Google Scholar
24. Lumley T: Survey: Analysis of Complex Survey Samples: R Package Version 3.6.5. 2006Google Scholar
25. Lumley T: Analysis of complex survey samples. Journal of Statistical Software 9:1–19, 2004Google Scholar
26. R: A Language and Environment for Statistical Computing. Vienna, Austria, Foundation for Statistical Computing, R Development Core Team, 2007. Available at www.R-project.org Google Scholar
27. Bradley KA, Bush KR, McDonell MB, et al: Screening for problem drinking: comparison of CAGE and AUDIT. Journal of General Internal Medicine 13:379–388, 1998Google Scholar
28. Del Boca FK, Noll JA: Truth or consequences: the validity of self-report data in health services research on addictions. Addiction 95(suppl 3):S347–S360, 2000Google Scholar
29. Del Boca FK, Darkes J: The validity of self-reports of alcohol consumption: state of the science and challenges for research. Addiction 98(suppl 2):1–12, 2003Google Scholar
30. Volk RJ, Steinbauer JR, Cantor SB, et al: The Alcohol Use Disorders Identification Test (AUDIT) as a screen for at-risk drinking in primary care patients of different racial/ethnic backgrounds. Addiction 92:197–206, 1997Google Scholar
31. Institute of Medicine: Unequal Treatment: Confronting Racial and Ethnic Disparities in Health Care. Washington, DC, National Academy Press, 2003Google Scholar