Datapoints: Trends in ADHD and Stimulant Use Among Children, 1993-2003
Trends in the diagnosis of attention-deficit hyperactivity disorder (ADHD) and use of stimulants in the 1990s have been studied, but little is known about changes in recent years. The study reported here used data from the National Ambulatory Medical Care Survey (NAMCS) and the National Hospital Ambulatory Medical Care Survey (NHAMCS) for the years 1993 to 2003 to examine these trends. The NAMCS is an annual survey of a national sample of office-based physician practices, and the annual NHAMCS captures information on hospital outpatient and emergency services. Together the two surveys provide a national estimate of health care utilization in U.S. ambulatory settings.
The study estimated the annual number of visits with a diagnosis of ADHD (ADHD visits) and visits with a prescription of a stimulant (stimulant visits) by children aged 3 to 18 years, as well as the annual proportion of ADHD visits with a prescription of a stimulant and stimulant visits with no ADHD diagnosis. Understanding these proportions is important for developing measures to assess the quality of care for children with ADHD (see www.ncqa.org). To produce national estimates, these visits were weighted by an inflation factor assigned to each visit.
Between 1993 and 2003 the number of outpatient visits by children grew from 131 million to 165 million. The number of ADHD visits rose 130 percent, from 3.2 million to 7.4 million. These totals represent 2.5 and 4.5 percent of all visits by children in 1993 and 2003, respectively. Meanwhile, the number of stimulant visits jumped from 2.7 million to 6.6 million, a twofold increase in terms of the proportion of all visits by children—2.1 to 4.0 percent.
The annual proportion of ADHD visits with a stimulant prescription remained relatively stable at about 70 percent. The exceptions were 1997 and 2003, in which the proportion was 64 percent. On the other hand, the proportion of stimulant visits with an ADHD diagnosis remained above 80 percent annually through 2001 but dropped to 72 percent in 2002 and 2003. On average, over the years studied, 20 percent of the stimulant visits did not have a diagnosis of ADHD recorded.
Diagnosis of ADHD and prescription of stimulants grew significantly from 1993 to 2003, in terms of both the annual number of visits and the proportion of all visits by children. The unit of analysis was the patient-physician encounter (not individual-level data), and the trend in ADHD diagnosis could potentially be explained by, among other factors, increased health-seeking behaviors of children with ADHD or heightened awareness among physicians and parents. Therefore, the findings do not necessarily reflect changes in the prevalence of ADHD among children.
A decrease in the proportion of ADHD visits with a prescription of a stimulant in 2003 could partly be accounted for by the adoption of the new nonstimulant ADHD drug atomoxetine (data not shown). A seemingly upward trend in the proportion of stimulant visits without an ADHD diagnosis could not be explained by changes in survey design, and no discernible trend in increased use of stimulants for a particular non-ADHD diagnosis (including narcolepsy) was observed. Thus the decrease in 2002 and 2003 could be due to random variation. Finally, whether trends in prescribing of stimulants represent overutilization, underutilization, or misuse of these drugs could not be evaluated.
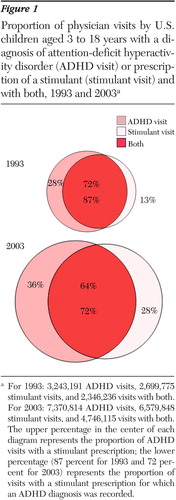
a For 1993: 3,243,191 ADHD visits, 2,699,775 stimulant visits, and 2,346,236 visits with both. For 2003: 7,370,814 ADHD visits, 6,579,848 stimulant visits, and 4,746,115 visits with both. The upper percentage in the center of each diagram represents the proportion of ADHD visits with a stimulant prescription; the lower percentage (87 percent for 1993 and 72 percent for 2003) represents the proportion of visits with a stimulant prescription for which an ADHD diagnosis was recorded.