Comparison of Self-Report and Clinician Ratings on Two Inventories of Depressive Symptomatology
Both clinical practice and clinical trial research would greatly benefit if a self-report rating of depression severity and specific depressive symptoms could be found that reasonably reflects findings obtained with more time-intensive clinician ratings. Such a finding would particularly benefit care of patients in the public health sector, where staff time is remarkably limited. Clinical trials involving patients with depression that use both clinician-rated and self-report measures to assess severity of depressive symptoms have typically found that clinician ratings and self-reports of depressive symptom severity are not in agreement ( 1 , 2 , 3 , 4 , 5 , 6 ). These discrepancies could be due to the differences in item content for the clinician and self-rating scales, different weightings for depressive symptom items, clinician or patient biases in describing symptomatology, presence or absence of psychotic symptoms, limited insight, and patient demographic characteristics—for example, education, race or ethnicity—and socioeconomic factors.
The opportunity to compare clinician and self-report depression ratings is presented by the 30-item Inventory of Depressive Symptomatology-Clinician-Rating (IDS-C-30), for which a matched self-report (IDS-Comparison SR-30) containing identical items has been developed ( 7 , 8 , 9 , 10 , 11 ). Both measures rate all DSM-IV core-criterion symptom domains—for example, mood, cognitive, psychomotor, and vegetative—to diagnose a major depressive episode and commonly associated symptoms—for example, anxious, melancholic, and atypical symptom features.
In hopes of further saving time and effort, Rush and colleagues ( 10 , 11 , 12 ) developed shortened versions of both the IDS-C-30 and the IDS-SR-30: the 16-item Quick Inventory of Depressive Symptomatology-Clinician Rated (QIDS-C-16) and the matching self-report version (QIDS-SR-16). The QIDS ratings include only 16 items from the IDS-C-30 and the IDS-SR-30 to assess the nine DSM-IV core-criterion symptom domains. The use of matched clinician and self-report tests provide an opportunity to determine whether a self-report can adequately assess response and remission and to compare these two perspectives for each of the symptoms rated and the overall total score among patients with depression.
This study compared the clinician-rated and the self-report versions of both the IDS-30 and the QIDS-16 to evaluate symptomatic status among outpatients with major depressive disorder who were treated in the public sector as part of the Texas Medication Algorithm Project (TMAP) ( 11 , 13 , 14 , 15 ). Clinician-rated and self-report versions of the IDS-30 and the QIDS-16 were compared on their ability to identify response and remission. The effect (if any) of various clinical and demographic features on total scores obtained from the clinician and patient perspectives was evaluated. Finally, item-by-item comparisons were made to compare the clinician and self-report ratings.
Methods
Participants
This study was approved by the Institutional Review Boards for the Protection of Human Research Subjects at the University of Texas Southwestern Medical Center at Dallas and the University of Texas at Austin. All participants signed written informed consent at study enrollment. Altogether, 544 adult outpatients with psychotic (N=106) or nonpsychotic (N=438) major depressive disorder were recruited from 14 outpatient mental health clinics through TMAP ( 11 , 13 , 15 ) between March 1998 and April 2000.
All participants were at least 18 years of age and met DSM-IV criteria for major depressive disorder (clinician diagnosis). Patients receiving mental retardation services or assertive community treatment ( 16 ) were excluded. All patients were expected to remain in the study for at least 12 months; however, a few remained up to 24 months. More information about the design of the TMAP is available elsewhere ( 13 ).
Rating scales
Either English or Spanish versions of the IDS-C-30 and the IDS-SR-30 were obtained when participants entered the study (baseline) and every three months after study entry by independent, unblinded research outcomes assessors, who were not involved in participants' treatment. Both ratings were scored by totaling responses to 28 of the 30 items (either appetite increase or decrease items and either weight increase or decrease items were scored). Possible scores range from 0 to 84, with higher scores indicating greater depressive symptom severity. Although the order of administration of the IDS-C-30 and the IDS-SR-30 was not controlled, the clinician completed the IDS-C-30 without knowledge of the patient's IDS-SR-30 responses.
Total scores on the QIDS-C-16 and the QIDS-SR-16 were derived from the relevant IDS-30 rating by isolating and analyzing the 16 items extracted from the 30-item ratings to form the QIDS-16. Total scores were computed by adding scores obtained for the following IDS-30 items: sad mood, concentration and decision making, worthlessness and guilt, suicidal ideation, interest, and energy and fatigability. Also included in the total score was the highest score on any one of the four sleep items (sleep onset insomnia, midnocturnal insomnia, early morning insomnia, and hypersomnia), the highest score on any one of the four appetite and weight change items (appetite increase, appetite decrease, weight increase, and weight decrease), and the highest score on the two psychomotor agitation and retardation items (psychomotor slowing and psychomotor agitation). Possible scores on each domain range from 0 to 3, and possible total scores range from 0 to 27, with higher scores indicating greater depressive symptom severity ( 10 , 11 , 12 ).
Drug and alcohol use disorders were assessed at baseline with the Drug Abuse Screening Test (DAST) ( 17 ) and the Michigan Alcohol Screening Test (MAST) ( 18 ). A score of 6 or more on the DAST and a score of 5 or more on the MAST indicates a substance use disorder.
Treatment
All participants could receive a prescription for any Food and Drug Administration-approved antidepressant medication on the basis of either clinician judgment (the treatment-as-usual group) or a medication algorithm ( 19 ). Visit frequency was determined by clinician judgment.
Statistical methods
Participants were evaluated who had both an IDS-C-30 and an IDS-SR-30 rating at baseline and at least one postbaseline evaluation. For this study, data were examined at baseline and at the last measurement available for each patient at or before month 12 of the study (study exit). Demographic and clinical baseline variables were compared between psychotic and nonpsychotic groups by using t tests or chi square tests, as appropriate. Patient response and remission rates during the study were computed for the IDS-C-30, the IDS-SR-30, the QIDS-C-16, and the QIDS-SR-16 scales. For each scale, treatment response was defined a priori as a reduction of at least 50 percent between the total score at baseline and at the last visit. For the IDS-30, the remission thresholds were a score of 12 or less for the clinician-rated version and a score of 14 or less for the self-report version ( 10 , 11 ). For both QIDS measures, the remission threshold was a score of 5 or less.
Agreement in the ascertainment of response and remission was evaluated by using the kappa statistic. McNemar's test determined whether the self-report versions of the IDS-30 and the QIDS-16 had a greater likelihood than the clinician-rated versions of classifying patients as responders or nonresponders. Agreement between total scores and items on the self-report and clinician-rated versions of the IDS-30 and the QIDS-16 was assessed by using the intraclass correlation coefficient (ICC). The ICC can range from -1 to 1, with higher numbers indicating greater agreement between scales. Both kappa and ICC measures of agreement can be interpreted according to the following guidelines: less than .40 represents poor to fair agreement, .41 to .60 represents moderate agreement, .61 to .80 represents good agreement, and more than .80 represents excellent agreement ( 20 ).
Discrepancies between the total scores on the self-report and clinician-rated versions of the IDS-30 and the QIDS-16 were defined for each individual on the basis of the difference in the relevant clinician-rated and self-report total scores. We then averaged the differences for all patients. Both mean and median differences between the total scores on the self-report and clinician-rated versions of the IDS-30 and the QIDS-16 were computed. As a measure of variability for the median, the 25th and 75th percentiles were used.
Kendall's product-moment correlations assessed whether the differences between the baseline total scores on the self-report and clinician-rated versions of the scales were related to age, age at onset of the first depressive episode, education, length of illness, or disposable income. Wilcoxon's two-sample test or the Kruskal-Wallis test assessed whether baseline differences between the total scores on the self-report and clinician-rated versions of the IDS-30 and the QIDS-16 were related to gender or race or ethnicity or to the presence or absence of psychosis, alcohol abuse, or general medical conditions. Nonparametric correlations and tests were used when a skewed data distribution was present.
Results
Table 1 summarizes the demographic and clinical features of the sample. On average, for the whole group, the mean±SD total IDS-C-30 score was 2.2±7.1 points lower than the mean total IDS-SR-30 score (t=7.1, df=543, p<.001), and the mean total QIDS-C-16 score was .3±2.8 points lower than the mean total QIDS-SR-16 score (t=2.6, df=543, p=.010).
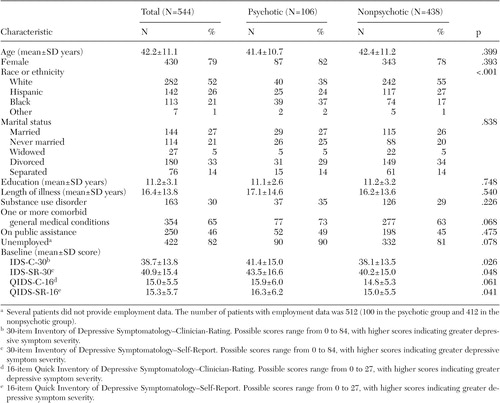 |
Only race or ethnicity distinguished patients with psychotic and nonpsychotic major depressive disorder. More patients with psychotic depression were African American than all of the other racial or ethnic groups (χ 2 =20.5, df=1, p<.001). Patients with psychotic depression had slightly greater levels of depressive symptoms by most measures.
Ratings of response and remission at exit
IDS-SR-30 versus IDS-C-30 . For the 438 patients without psychosis, treatment response was obtained by 102 patients (23 percent) on the basis of the self-report version and by 90 patients (21 percent) on the basis of the clinician-rated version of the IDS-30. For the 106 patients with psychosis, 28 (26 percent) responded to treatment as determined by the self-report version and 27 (25 percent) responded as determined by the clinician-rated version. As shown in Table 2 , substantial agreement was found between the IDS-C-30 and the IDS-SR-30 total scores in identifying responders among patients with psychosis ( κ =.78) and those without psychosis ( κ =.68). For nonpsychotic responders and nonresponders, the IDS-SR-30 and the IDS-C-30 agreed in their classification of response and nonresponse for 390 patients (89 percent). Altogether, 30 of 438 patients (7 percent) were classified as responders on the IDS-SR-30 and as nonresponders on the IDS-C-30. Conversely, 18 patients (4 percent) were classified as nonresponders on the IDS-SR-30 and as responders on the IDS-C-30. No difference in the likelihood of the IDS-SR-30 and the IDS-C-30 in declaring response was found for either the psychotic or nonpsychotic groups.
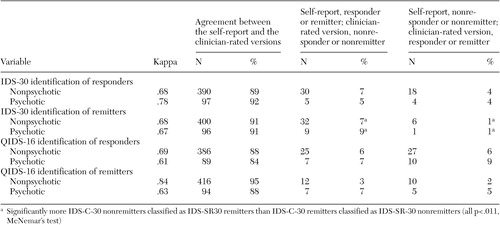 |
For patients without psychosis, 83 patients (19 percent) were found to be in remission according to the self-report, as determined by a score of 14 or less on the IDS-SR-30 at exit, and 57 patients (13 percent) were found to be in remission according to the clinician-rated version, as determined by a score of 12 or less on the IDS-C-30. For patients with psychosis, 22 patients (21 percent) were found to be in remission according to the IDS-SR-30 and 14 (13 percent) were found to be in remission according to the IDS-C-30. Agreement between the IDS-C-30 and the IDS-SR-30 in identification of remission was also high for patients without psychosis ( κ =.68) and for those with psychosis ( κ =.67). For the nonpsychotic group, the IDS-SR-30 and the IDS-C-30 agreed in terms of remission at study exit for 400 patients (91 percent). Thirty-two nonpsychotic patients (7 percent) were classified as being in remission on the IDS-SR-30 and as not being in remission on the IDS-C-30, and six nonpsychotic patients (1 percent) were classified as not being in remission on the IDS-SR-30 and as being in remission on the IDS-C-30 (χ 2 =17.8, df=1, p<.001). The IDS-SR-30 was also more likely than the IDS-C-30 to determine remission for patients with psychosis (χ 2 =6.4, df=1, p=.011).
QIDS-SR-16 versus QIDS-C-16. Altogether, 114 patients without psychosis (26 percent) responded to treatment on the basis of the QIDS-SR-16 and 116 (26 percent) responded according to the QIDS-C-16. For patients with psychosis, 29 patients (27 percent) responded to treatment on the basis of the QIDS-SR-16, and 32 (30 percent) responded on the basis of the QIDS-C-16. As shown in Table 2 , substantial agreement between the self-report and the clinician-rated versions of the QIDS-16 in identifying responders was found for those with ( κ =.61) and without ( κ =.69) psychotic features. The QIDS-SR-16 and the QIDS-C-16 agreed on classification of responders or nonresponders at study exit for 386 patients without psychosis (88 percent). Altogether, 25 patients (6 percent) were classified as responders according to the QIDS-SR-16 and as nonresponders according to the QIDS-C-16, and 27 (6 percent) were classified as nonresponders on the QIDS-SR-16 and as responders on the QIDS-C-16. There was no significant difference between the selfreport and the clinician-rated versions of the QIDS-16 in the likelihood of classifying a patient as a responder or a nonresponder. For those with psychotic symptoms, similar results were found for the declaration of response by the QIDS-C-16 and the QIDS-SR-16.
For nonpsychotic patients, remission (defined by an exit score of 5 or less on the QIDS-SR-30 or on the QIDS-C-30) was attained by 83 patients (19 percent) on the basis of the QIDS-SR-16 and by 81 patients (18 percent) on the basis of the QIDS-C-16. Similar remission rates were obtained for the psychotic group (21 patients, or 20 percent, based on the QIDS-SR-16 and 19 patients, or 18 percent, based on the QIDS-C-16). For the declaration of remission, there was agreement between the QIDS-C-16 and the QIDS-SR-16 for the psychotic ( κ =.63) and nonpsychotic ( κ =.84) groups. The QIDS-SR-16 and the QIDS-C-16 gave the same classification for remission and nonremission for 416 patients without psychosis (95 percent). The QIDS-SR-16 was no more or less likely to ascribe remission than the QIDS-C-16. Specifically, 12 patients (3 percent) were classified as being in remission by the QIDS-SR-16 and as not being in remission by the QIDS-C-16, and ten patients (2 percent) were classified as not being in remission by the QIDS-SR-16 and as being in remission by the QIDS-C-16. Similar results were found for the psychotic group.
Influence of clinical and demographic characteristics
Differences in baseline IDS-SR-30 and IDS-C-30 total scores. Overall, for the 544 participants, the median difference in baseline total scores was 1.0 point greater with the IDS-SR-30 than with the IDS-C-30 (mean difference=2.2±7.1 points). Altogether, 136 patients (25 percent) had an IDS-SR-30 score that was more than 1.7 points less than the IDS-C-30 score, whereas another 136 patients (25 percent) had an IDS-SR-30 score that was at least 6 points higher than the IDS-C-30 score. Agreement between total scores was excellent (ICC=.88), and the correlation between total scores was also high (r=.89, p<.001).
For the 106 patients with psychosis, the median difference between the self-report and clinician-rated versions of the IDS-30 was 2.0 points (mean±SD difference=2.1±7.8), whereas for the 438 patients without psychosis, the median difference was .7 points (mean difference=2.2±6.9 points). The variance between the IDS-C-30 and the IDS-SR-30 total scores was not statistically significant between the patients with psychosis and those without. The ICC for agreement between total scores was .88 for both patients with psychosis and those without. Correlations between total scores were high for both patients with psychosis and those without (r=.88 and .89, respectively).
For the full sample, differences between the IDS-SR-30 and the IDS-C-30 baseline total scores were not related to age, gender, age at onset of illness, length of illness, education level, family size, disposable income, presence or absence of psychosis, presence or absence of a concurrent general medical condition, or presence or absence of alcohol or drug abuse or dependence. Only race or ethnicity was significantly related to the difference between the IDS-SR-30 and the IDS-C-30 (χ 2 =10.7, df=2, p=.005). The IDS-SR-30 score was higher than the IDS-C-30 score by a median of 2.0 points for whites and by 3.0 points for African Americans. For Hispanics, the median was 0 points.
For the 106 patients with psychosis, only family size was significantly related to the difference between the IDS-SR-30 and the IDS-C-30 scores. Larger family size positively correlated with a larger difference between the two scales (r=.21, p=.003).
For the 438 patients without psychosis, only age and race or ethnicity were significantly related to the difference in the IDS-C-30 and the IDS-SR-30 total baseline scores. Age was minimally related (r=.07, p=.043). Whites and African Americans had an IDS-SR-30 baseline score a median 2.0 points higher than their IDS-C-30 score, whereas there was no difference for Hispanics (.0 points) (χ 2 =15.5, df=2, p<.001).
Differences in baseline QIDS-SR-16 and QIDS-C-16 total scores. Overall, the median difference between the QIDS-SR-16 and the QIDS-C-16 baseline total scores was .0 points. Altogether, 27 patients (25 percent) had a QIDS-SR-16 score that was more than 1.0 point less than the QIDS-C-16 score, while another 27 patients (25 percent) had a QIDS-SR-16 score that was more than 2.0 points greater than the QIDS-C-16 score. For both the psychotic and nonpsychotic groups, the median difference between the QIDS-SR-16 and the QIDS-C-16 was also .0 points (mean difference=.4±2.9 points for the group with psychosis and .3±2.8 points for the group without psychosis). ICCs indicated excellent agreement between the QIDS total scores for all patients (ICC=.87), for patients with psychosis (ICC=.89), and for those without psychosis (ICC=.86). Also, correlations between total scores were high for all patients (r=.87, p<.001), as well as for patients with psychosis (r=.89, p<.001) and for those without (r=.86, p<.001).
For all 544 patients, the differences between the QIDS-SR-16 and the QIDS-C-16 baseline total scores were unrelated to any clinical or demographic variables, including race and ethnicity.
For the 438 patients without psychosis, only the length of illness (r=.07, p=.040) was statistically, but not clinically, significantly related to the difference between the QIDS-C-16 and the QIDS-SR-16 baseline total scores.
For the 106 patients with psychosis, the difference between the QIDS-SR-16 and the QIDS-C-16 baseline total scores was significantly, but minimally, related only to family size (r=.15, p=.039).
Differences in ratings for symptom items on the IDS-SR-30 and IDS-C-30.Table 3 shows the ICCs for individual symptom items for the IDS-SR-30 and the IDS-C-30 for patients with psychosis and for those without psychosis at study exit. For patients without psychosis, all items showed good to excellent agreement except for morning insomnia, mood variation, quality of mood, psychomotor slowing, psychomotor agitation, sympathetic arousal, and rejection sensitivity. Similar results were found for most, but not all, items for patients with psychosis.
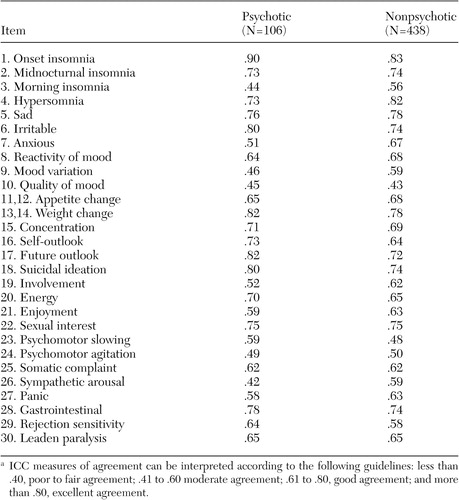 |
a ICC measures of agreement can be interpreted according to the following guidelines: less than .40, poor to fair agreement; .41 to .60 moderate agreement; .61 to .80, good agreement; and more than .80, excellent agreement.
Differences in domain scores on the QIDS-SR-16 and QIDS-C-16.Table 4 shows the ICCs at exit between the QIDS-SR-16 and the QIDS-C-16 total scores for each of the nine criterion domains assessed by the QIDS for psychotic and nonpsychotic groups. All items showed good to excellent agreement for both psychotic and nonpsychotic groups as indicated by ICCs above .60, except for psychomotor changes and involvement for the psychotic group.
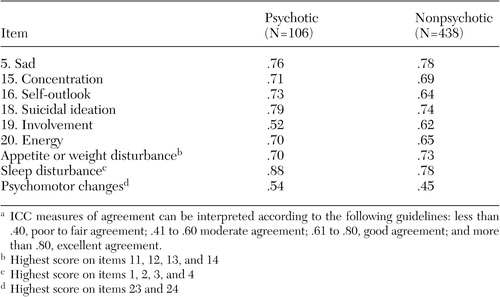 |
a ICC measures of agreement can be interpreted according to the following guidelines: less than .40, poor to fair agreement; .41 to .60 moderate agreement; .61 to .80, good agreement; and more than .80, excellent agreement.
Discussion
The IDS-C-30 and the IDS-SR-30 agreed on the declaration of treatment response and remission for 90 percent or more of the patients. When the two ratings disagreed in the declaration of response, the likelihood of being declared a responder by the IDS-C-30 and a nonresponder by the IDS-SR-30 was equally likely as the converse. For remission, the IDS-SR-30 was more likely to declare remission than the IDS-C-30 when there was disagreement. These response and remission findings applied to the total group (N=544) (data not shown) and to both the psychotic (N=106) and nonpsychotic (N=438) groups.
Age, gender, age at onset of illness, length of illness, education level, family size, disposable income, presence or absence of psychosis, presence or absence of general medical conditions, and presence or absence of alcohol or drug abuse or dependence did not account for differences in the IDS-SR-30 and the IDS-C-30 total scores among individuals. Whites had a median total score 2.0 points higher on the IDS-SR-30 than on the IDS-C-30, whereas the median difference in total score between the IDS-SR-30 and the IDS-C-30 was 3.0 points for African Americans and .0 points for Hispanics. This modest difference suggests that compared with other groups, African Americans may self-report symptom levels that are slightly higher than those recognized by clinicians or that clinicians may be less astute at identifying symptoms in this group, compared with what the patients actually experience.
In addition, an analysis of specific symptom items on the IDS-30 revealed moderate agreement for the nonpsychotic group on morning insomnia, diurnal mood variation, distinct quality of the mood, psychomotor slowing, sympathetic nervous system arousal, and interpersonal rejection sensitivity. All other items were in the good to excellent range (ICC≥.60). Similar findings were noted for the psychotic group, except that anxious mood, involvement, enjoyment, and panic symptoms were in the moderate range (ICC=.4 to .6).
The QIDS-C-16 and the QIDS-SR-16 agreed in the declaration of treatment response for 87 percent of the total sample and for 84 percent of patients with psychosis and 88 percent of patients without psychosis. When the two scales disagreed that response (or nonresponse) had occurred, there was no difference between the scales in declaring response or nonresponse. The QIDS-C-16 and the QIDS-SR-16 agreed in 94 percent of cases in the declaration of remission, with no bias between the scales, for the whole sample or for the two groups, when the two scales did not agree that remission was present.
Overall, the median difference between the QIDS-SR-16 and the QIDS-C-16 total scores was 0 points. No clinical or demographic baseline parameters were meaningfully related to the differences in the QIDS-C-16 and the QIDS-SR-16 total scores for the total group and for the psychotic and nonpsychotic groups.
For the nine DSM-IV criterion symptom domains measured in the QIDS-16, only psychomotor changes were in the moderate agreement range (ICC=.40 to .60) for both groups; for involvement ratings were in moderate agreement only for the patients with psychosis.
These findings suggest that for clinical and for research purposes, the overall ratings of symptom severity and the declaration of response by either the self-report or the clinician-rated versions of the IDS-30 or the QIDS-16 will be highly similar. Furthermore, and somewhat surprisingly, the presence or absence of psychosis did not meaningfully affect the propensity of any of these four measures to recognize response. Although the IDS-SR-30 was somewhat more likely to declare remission than the IDS-C-30, there was no bias between the IDS-C-30 and the IDS-SR-30 in declaring response. The QIDS-C-16 and the QIDS-SR-16 displayed no bias in the declaration of either response or remission.
It is difficult to compare these findings with the literature because most studies have compared self-reports—typically the Beck Depression Inventory (BDI) ( 21 )—with clinician ratings—typically the Hamilton Rating Scale for Depression (HRSD) ( 22 , 23 )—that do not share identical items. These studies have found correlations of .4 to .7 ( 24 ).
Among patients who recently experienced a myocardial infarction, Strik and colleagues ( 25 ) found comparable performance between several self-reports—the Hospital Anxiety and Depression Rating ( 26 ), the Symptom Checklist 90 ( 27 , 28 ), and the BDI—and the HRSD-17 in the detection of major depressive disorder, as defined by the Structured Clinical Interview for DSM-IV (SCID) ( 29 ). Enns and colleagues ( 30 ) surveyed 94 SCID-diagnosed outpatients with major depressive disorder and found that younger age and higher education predicted higher BDI scores relative to HRSD-17 scores. Higher neuroticism, lower extraversion, and lower agreeableness on the NEO-Five Factor Inventory ( 31 , 32 ) were associated with higher BDI scores relative to HRSD-21 scores. Of note, Lyness and colleagues ( 33 ), Wallace and Pfohl ( 34 ), and Enns and colleagues ( 30 ) found that age negatively correlated with the difference between BDI and HRSD total scores. These differences among older and younger patients were due to differences in ratings of psychological and cognitive symptoms rather than somatic symptoms ( 30 )—that is, younger patients reported more such symptoms than older patients. In addition, Enns and colleagues ( 30 ) found less discrepancy between BDI and HRSD-21 total scores among melancholic patients with depression, as opposed to non-melancholic patients with depression. Significantly discordant ratings have been observed for a substantial number of patients ( 1 , 4 , 35 , 36 ). Discordant findings are likely due in part to the different item content of the two scales ( 37 , 38 , 39 ).
The study presented here used identical items in the clinician-rated and self-report measures. We found very few clinical or sociodemographic variables related to modest to minimal discrepancies in total scores (the IDS-C-30 compared with the IDS-SR-30 and the QIDS-SR-16 compared with the QIDS-C-16).
Of the two scales, the QIDS-16 performed at least as well and sometimes better than the IDS-30. Both the IDS-30 and the QIDS-16 were in substantial agreement in declaring response and remission between the self-report and the clinician-rated versions of the two scales. No apparent bias was found between the self-report and the clinician-rated versions of the QIDS-16—that is, in cases where the two ratings did not agree, one version did not preferentially declare nonresponse or nonremission. Finally, the QIDS-16 total scores using the clinician-rated and self-report versions were in agreement across the racial and ethnic groups.
These findings add significantly to previous evaluations of the IDS and the QIDS ( 10 , 11 , 40 ). These findings also extend and confirm an earlier report in a different group of public-sector patients ( 41 ). Our results provide reassurance that neither the IDS nor the QIDS is substantially affected by diverse baseline features. Surprisingly, even with patients with psychotic depression, the self-report versions of the IDS and the QIDS were in substantial agreement with the clinician versions. Thus the use of these two self-reports in both routine practice and in efficacy or effectiveness studies in the public sector is supported.
Whether these results apply to other scales for which there are both self-report and clinician ratings is unclear. For example, self-reports are available for the Montgomery Äsberg Depression Rating Scale (MADRS) ( 42 , 43 ) and for the HRSD-17 ( 22 , 23 , 44 ) clinician ratings. Neither rating, however, includes all nine criterion symptom domains, and for the HRSD, certain items are confounded—for example, item 7, which measures both work and interest. The CRS performs well against the HRSD-17, but the number of responses required is high (52 yes or no questions).
Study limitations include the nature of the sample ( 13 ). Although our sample was ethnically and racially diverse, it largely lacked Asian patients. Participants had low incomes, were largely unemployed, and had longstanding depression. Thus generalizability is limited. When measures were obtained, nearly all participants were taking medications for depression or concomitant general medical conditions. These medications could have affected symptomatic presentations, but they should not logically differentially affect clinician and self-report ratings. Finally, the QIDS-16 items and scores were extracted from the IDS-30 ratings, rather than representing an independent collection of the QIDS-16 scores.
Conclusions
Given the high correspondence between self-report and clinician ratings, the findings of this study support the use of either the self-report version of the IDS-30 or the QIDS-16 to measure depressive symptom severity and to declare response or remission among public-sector patients with depression. Notably, outpatients with psychotic depression, who were largely nonelderly, also appear to reliably self-report symptoms as accurately as patients with nonpsychotic depression.
Acknowledgments
The authors thank Kenneth Z. Altshuler, M.D., and Eric J. Nestler, M.D., Ph.D., for their administrative support. This research was supported by grant MH-53799 from the National Institute of Mental Health and by the Robert Wood Johnson Foundation, the Meadows Foundation, the Lightner-Sams Foundation, the Nanny Hogan Boyd Charitable Trust, the Texas Department of Mental Health and Mental Retardation, the Center for Mental Health Services, the Department of Veterans Affairs Health Services Research and Development Research Career Scientist Award (RCS92-403) (Kashner), the Betty Jo Hay Distinguished Chair in Mental Health and the Rosewood Corporation Chair in Biomedical Science (Rush), the United States Pharmacopoeia Convention, Inc., and Mental Health Connections, a partnership between Dallas County Mental Health and Mental Retardation and the Department of Psychiatry of the University of Texas Southwestern Medical Center—which received funding from the Texas State Legislature and the Dallas County Hospital District, the University of Texas at Austin College of Pharmacy, and the Southwestern Drug Corporation Centennial Fellowship in Pharmacy (Crismon).
1. Bailey J, Coppen A: A comparison between the Hamilton Rating Scale and the Beck Inventory in the measurement of depression. British Journal of Psychiatry 128:486-469, 1976Google Scholar
2. Rush AJ, Hiser W, Giles DE: A comparison of self-reported versus clinician-related symptoms in depression. Journal of Clinical Psychiatry 48:246-248, 1987Google Scholar
3. Tondo L, Burrai C, Scamonatti L, et al: Comparison between clinician-rated and self-reported depressive symptoms in Italian psychiatric patients. Neuropsychobiology 19:1-5, 1988Google Scholar
4. Domken M, Scott J, Kelly P: What factors predict discrepancies between self and observer ratings of depression? Journal of Affective Disorders 31:253-259, 1994Google Scholar
5. Corruble E, Legrand JM, Duret C, et al: IDS-C and IDS-SR psychometric properties in depressed in-patients. Journal of Affective Disorders 56:95-101, 1999Google Scholar
6. Corruble E, Legrand JM, Zvenigorowski H, et al: Concordance between self-report and clinician's assessment of depression. Journal of Psychiatric Research 33:457-465, 1999Google Scholar
7. Rush AJ, Giles DE, Schlesser MA, et al: The Inventory for Depressive Symptomatology (IDS): preliminary findings. Psychiatry Research 18:65-87, 1986Google Scholar
8. Rush AJ, Gullion CM, Basco MR, et al: The Inventory of Depressive Symptomatology (IDS): psychometric properties. Psychological Medicine 26:477-486, 1996Google Scholar
9. Gullion CM, Rush AJ: Toward a generalizable model of symptoms in major depressive disorder. Biological Psychiatry 44:959-972, 1998Google Scholar
10. Rush AJ, Trivedi MH, Ibrahim HM, et al: The 16-Item Quick Inventory of Depressive Symptomatology (QIDS), Clinician Rating (QIDS-C), and Self-Report (QIDS-SR): a psychometric evaluation in patients with chronic major depression. Biological Psychiatry 54:573-583, 2003Google Scholar
11. Trivedi MH, Rush AJ, Ibrahim HM, et al: The Inventory of Depressive Symptomatology, Clinician Rating (IDS-C) and Self-Report (IDS-SR), and the Quick Inventory of Depressive Symptomatology, Clinician Rating (QIDS-C) and Self-Report (QIDS-SR) in public sector patients with mood disorders: a psychometric evaluation. Psychological Medicine 34:73-82, 2004Google Scholar
12. Rush AJ, Carmody T, Reimitz P-E: The Inventory of Depressive Symptomatology (IDS): clinician (IDS-C) and self-report (IDS-SR) ratings of depressive symptoms. International Journal of Methods in Psychiatric Research 9:45-59, 2000Google Scholar
13. Rush AJ, Crismon ML, Kashner TM, et al: TMAP Research Group. Texas Medication Algorithm Project, phase 3 (TMAP-3): rationale and study design. Journal of Clinical Psychiatry 64:357-369, 2003Google Scholar
14. Suppes T, Rush AJ, Dennehy EB, et al: Texas Medication Algorithm Project, phase 3 (TMAP-3): clinical results for patients with a history of mania. Journal of Clinical Psychiatry 64:370-382, 2003Google Scholar
15. Trivedi MH, Rush AJ, Crismon ML, et al: Texas Medication Algorithm Project (TMAP): clinical results for patients with major depressive disorder. Archives of General Psychiatry 61:669-680, 2004Google Scholar
16. Stein L, Test M: Alternative to mental hospital treatment: I. conceptual model, treatment program, and clinical evaluation. Archives of General Psychiatry 37:392-397, 1980Google Scholar
17. Skinner HA: The Drug Abuse Screening Test. Addictive Behavior 7:363-371, 1982Google Scholar
18. Selzer MJ: The Michigan Alcoholism Screening Test: the quest for a new diagnostic instrument. American Journal of Psychiatry 127:89-95, 1971Google Scholar
19. Crismon ML, Trivedi MH, Pigott TA, et al: The Texas Medication Algorithm Project: report of the Texas Consensus Conference Panel on Medication Treatment of Major Depressive Disorder. Journal of Clinical Psychiatry 60:142-156, 1999Google Scholar
20. Landis JR, Koch GG: The measurement of observer agreement for categorical data. Biometrics 33:159-174, 1977Google Scholar
21. Beck AT, Ward CH, Mendelson M, et al: An inventory for measuring depression. Archives of General Psychiatry 4:561-571, 1961Google Scholar
22. Hamilton M: A rating scale for depression. Journal of Neurology, Neurosurgery, and Psychiatry 23:56-62, 1960Google Scholar
23. Hamilton M: Development of a rating scale for primary depressive illness. British Journal of Social and Clinical Psychology 6:278-296, 1967Google Scholar
24. Richter P, Werner J, Heerlein A, et al: On the validity of the Beck Depression Inventory. Psychopathology 31:160-168, 1998Google Scholar
25. Strik JJ, Honig A, Lousberg R, et al: Sensitivity and specificity of observer and self-report questionnaires in major and minor depression following myocardial infarction. Psychosomatics 42:423-428, 2001Google Scholar
26. Zigmond AS, Snaith RP: The Hospital Anxiety and Depression Scale. Acta Psychiatrica Scandinavica 67:361-370, 1983Google Scholar
27. Derogatis LR: SCL-90-R: Administration, Scoring, and Procedures Manual: I: for the Revised Version. Baltimore, Johns Hopkins University, Clinical Psychometrics Research Unit, 1977Google Scholar
28. Derogatis LR, Cleary PA: Conformation of the dimensional structure of the SCL-90: a study in construct validity. Journal of Clinical Psychology 33:981-989, 1977Google Scholar
29. First MB, Spitzer RL, Williams JBW, et al: Structured Clinical Interview for DSM-IV-TR (SCID-I): User's Guide and Interview-Research Version. New York, New York Psychiatric Institute, Biometrics Research Department, 2001Google Scholar
30. Enns MW, Larsen DK, Cox BJ: Discrepancies between self and observer ratings of depression: the relationship to demographic, clinical and personality variables. Journal of Affective Disorders 60:33-41, 2000Google Scholar
31. Costa PT Jr, McCrae RR: The NEO Personality Inventory Manual. Orlando, Fla, Psychological Assessment Resources Inc, 1985Google Scholar
32. Costa PT Jr, McCrae RR: Revised NEO Personality Inventory (Neo-PI-R) and NEO Five-Factor Inventory (NEO-FFI): Professional Manual. Odessa, Fla, Psychological Assessment Resources, 1992Google Scholar
33. Lyness JM, Cox C, Curry J, et al: Older age and the underreporting of depressive symptoms. Journal of the American Geriatrics Society 43:216-221, 1995Google Scholar
34. Wallace J, Pfohl B: Age-related differences in the symptomatic expression of major depression. Journal of Nervous and Mental Disease 183:99-102, 1995Google Scholar
35. Prusoff BA, Klerman GL, Paykel ES: Concordance between clinical assessments and patients' self-report in depression. Archives of General Psychiatry 26:546-552, 1972Google Scholar
36. Sayer NA, Sackeim HA, Moeller JR, et al: The relations between observer-rating and self-report of depressive symptomatology. Psychological Assessment 5:350-360, 1993Google Scholar
37. Brown C, Schulberg HC, Madonia MJ: Assessing depression in primary care practice with the Beck Depression Inventory and the Hamilton Rating Scale for Depression. Psychological Assessment 7:59-65, 1995Google Scholar
38. Moran PW, Lambert MJ: A review of current assessment tools for monitoring changes in depression, in The Assessment of Psychotherapy Outcome. Edited by Lambert MS, Christensen ER, Dejulio SS. New York, Wiley, 1983Google Scholar
39. Steer RA, Beck AT, Riskind JH, et al: Relationships between the Beck Depression Inventory and the Hamilton Rating Scale for Depression in depressed outpatients. Journal of Psychopathological Behavior 9:327-339, 1987Google Scholar
40. Rush AJ, Bernstein IH, Trivedi MH, et al: An evaluation of the Quick Inventory of Depressive Symptomatology and the Hamilton Rating Scale for Depression: a STAR*D report. Biological Psychiatry 59:493-501, 2006Google Scholar
41. Biggs MM, Shores-Wilson K, Rush AJ, et al: A comparison of alternative assessments of depressive symptom severity: a pilot study. Psychiatry Research 96:269-279, 2000Google Scholar
42. Montgomery SA, Äsberg M: A new depression scale designed to be sensitive to change. British Journal of Psychiatry 134:382-389, 1979Google Scholar
43. Svanborg P, Äsberg M: A comparison between the Beck Depression Inventory (BDI) and the self-rating version of the Montgomery Äsberg Depression Rating Scale (MADRS). Journal of Affective Disorders 64:203-216, 2001Google Scholar
44. Feinberg M, Carroll BJ, Smouse PE, et al: The Carroll Rating Scale for Depression: III. comparison with other rating instruments. British Journal of Psychiatry 138:205-209, 1981Google Scholar