An Analysis of the Slowdown in Growth of Spending for Psychiatric Drugs, 1986–2008
Abstract
Objective:
This study analyzed recent trends in spending on psychiatric prescription drugs and underlying factors that served as drivers of these changes.
Methods:
Data were collected from the MarketScan Commercial Claims and Encounters Database (1997–2008), Substance Abuse and Mental Health Services Administration spending estimates (1986–2005), and the Medical Expenditure Panel Survey (1997–2007). The trends in medication spending derived from the data were decomposed into three categories: percentage of enrollees who used psychiatric medications, days supplied per user, and cost per day supplied.
Results:
The average annual rate of growth in expenditures per enrollee slowed from 18.5% in 1997–2001 to 6.3% in 2001–2008. A decline in the growth rate of cost per day supplied, from 8% to 2%, accounted for 49% of the overall decline in spending growth, and a decline in the growth of the percentage of enrollees who used medication, from 7% to 2%, contributed 41% to the overall decline. There was a smaller change in days supplied per user, from 3% to 2%, that contributed 10% to the overall decline. The increased entry of generic medications, which constituted 70% of all psychiatric prescriptions by 2008, particularly generic antidepressants, was a key contributor to the slower growth in costs.
Conclusions:
Past high growth in psychiatric drug spending arising from growth in utilization of branded medications has declined significantly, which may have implications for access and new product investment. (Psychiatric Services 63:13–18, 2012)
Prescription medications are a cornerstone of mental health treatment and until recently have been a key driver of mental health treatment spending (1–4). From 1993 to 2003, spending on retail prescription drugs was responsible for 46% of the increase in total public and private mental health expenditures. Psychiatric drugs have also been an important driver of spending on medications used to treat all conditions. For example, in 2005, prescriptions for psychiatric drugs made up 26% of total Medicaid spending for drugs and 14% of total spending on drugs by private insurance (5,6).
Growth in spending for psychotropic medications was particularly high from 1997 to 2001, when expenditures on these drugs increased, on average, by 24% annually. During that time, spending on these drugs as a proportion of all mental health spending increased from 14% in 1997 to 23% in 2001. The average increase in the spending rate for psychotropic medications between 1997 and 2001 was higher than that for all prescription drugs (24% versus 16%, respectively) (5,6).
In this article, we present new data on spending and utilization of psychotropic medications in the United States and analyze drivers of recent spending trends. Some of the underlying factors that may have contributed to the spending changes—such as prescription drug benefit design, safety concerns, entry of new products, and expanded indications for existing products—are discussed.
Methods
Trends in spending for psychotropic prescription medications and their components, including the percentage of the population using a medication, the intensity of utilization, and the cost per day, were examined. The main data source used for the analyses was the MarketScan Commercial Claims and Encounters Database for the period 1997 through 2008. We also present some national all-payer results from the Substance Abuse and Mental Health Services Administration (SAMHSA) spending estimates for the period 1986 through 2005, and we conducted some analyses using the Medical Expenditure Panel Survey (MEPS) for the period 1997 through 2007.
Data from 1986 to 2005 SAMHSA spending estimates provided information about national spending on services related to the diagnosis and treatment of mental illness and substance use disorders and were compared with spending data on all health care. The estimates use many of the same definitions, data, sources, and methods as the national health expenditure accounts produced by the Centers for Medicare and Medicaid Services (CMS). The SAMHSA drug-spending estimates primarily rely on the household component of the MEPS, which is administered by the Agency for Healthcare Research and Quality. Psychiatric drug spending is calculated by multiplying the ratio of MEPS psychiatric drug spending to MEPS all-drug spending times all-drug spending from the CMS national health expenditure accounts.
MEPS is an ongoing household survey of the civilian, noninstitutionalized population in the United States. Sample sizes range from approximately 22,000 to 37,000 respondents. The survey asks households to report detailed information about each prescription drug used. Follow-back surveys to pharmacies obtain more complete information on spending, quantities filled, and other information.
Weights were used to allow the MEPS to be representative of the noninstitutionalized U.S. population. Psychiatric medication classes were identified by the Multum classification system, which is available on the database. As an additional check, the SAMHSA medication spending estimates were compared to medication spending data obtained from IMS Health's National Prescription Audit. More details on the methods used to create the SAMHSA spending estimates have been published elsewhere (5,6).
The MarketScan Database was used to derive and decompose more recent psychotropic prescription spending trends among respondents with private insurance. The database contains insurance claims records from approximately 30 million covered employees and dependents annually who received their coverage through approximately 150 employers and regional health plans (7). Information on prescription drug spending was obtained from claims for prescription drugs filled at retail and through mail order pharmacies. Each prescription drug claim includes information on the type of medication, the transaction price, and the number of days for which a prescription was written (days supplied).
The change in psychiatric drug spending per enrollee, including employees and dependents, was decomposed into the change in days supplied per user of psychiatric medication, percentage of enrollees who were users, and cost per day supplied. Supplied days per user can generally be interpreted as the intensity of utilization. The greater the increase in number of days supplied over the course of a year, the longer the time the patient is likely to use the medication.
The number of users per enrolled population represented the proportion of enrollees who were filling prescriptions for psychiatric medication. This proportion was calculated by dividing the number of users of psychotropic drugs (as determined by the unique identification on each prescription drug record) by the number of people in the database each year (as determined by the unique enrollee identification on each beneficiary enrollment record). We did not limit the analysis to individuals who were continuously enrolled. The cost per day was calculated by dividing spending on psychiatric drugs per enrollee by the number of days for which medication was supplied—the term “price” was shorthand for average spending per day supplied.
Each prescription drug claim on the MarketScan database also indicated whether the prescription was for a generic or brand medication; this information was mapped to the database by using Red Book, a classification system that relies on National Drug Codes. This information, along with the transaction price of each prescription, can be used to compare the average costs of branded and generic medications.
Estimates of spending on retail prescription medications for treating mental health conditions included expenditures on antidepressants; antipsychotics; anxiolytics, sedatives, and hypnotics; and medications for treating attention-deficit hyperactivity disorder (ADHD) (stimulants). Psychotropic medications were identified on the basis of Red Book. No attempt was made to determine whether the medications were being used for indications approved by the U.S. Food and Drug Administration (FDA) or were being used for off-label conditions because that information is generally not available from these data sets. Research from a national survey of U.S. physicians indicated that 99% of antipsychotics, 93% of antidepressants, and 68% of anxiolytics were prescribed for psychiatric conditions (8). It should also be noted that the data reflected only retail and mail order prescription medications. Medications that were provided elsewhere, such as in hospitals or long-term care facilities, were excluded.
Because MarketScan data are not nationally representative, we also examined changes in the number of users of psychotropic medications by using the household component of the MEPS.
Results
Spending trends
The most recent SAMHSA spending estimates indicated that mental health prescription spending as a proportion of spending for all prescription medications grew from 9.7% in 1986 to 15% in 2005. By 2005, spending on psychotropic medications totaled $30 billion and constituted more than 27% of total spending on mental health treatment.
As shown in Figure 1, the highest period of growth between 1986 and 2005 occurred from 1997 to 2001, when drug spending increased by 24% annually. In contrast, the most recent period (2002–2005) witnessed a significant decline in the growth of psychiatric prescription drug spending. The average annual growth rate had dropped to 16% in 2002 and slowed to 11% in 2003, 10% in 2004, and just 6% in 2005. In absolute nominal dollars, the largest increase occurred between 1999 and 2000, when spending grew by $3.58 billion, followed by increases of $3.41 billion in 2000–2001, $3.13 billion in 2001–2002, $2.58 billion in 2002–2003, $2.57 billion in 2003–2004, and $1.58 billion in 2004–2005.
In the 12 years before 2005, growth in spending on psychiatric drugs exceeded that of all prescription drugs, but by 2004–2005 growth in spending for psychiatric and all prescription drugs was about the same. Growth in spending on psychiatric drugs peaked at a higher level for Medicaid than for private insurance, but spending by both began to decline after 2001 (Figure 1).
Analyses of MarketScan data from individuals with private employer-sponsored health insurance also showed high growth in psychiatric drug spending from 1997 through 2001 followed by a downturn from 2001 through 2008 (Table 1 and Figure 2) The average annual growth rate of psychiatric prescription drug expenditures per enrollee decelerated from 19% in 1997–2001 to 9% in 2001–2005 and 3.2% in 2005–2008 (Figure 2). The gross domestic product (GDP) price deflator, a measure of general price inflation, was relatively low over the whole period (Table 1). It grew from an average annual rate of 1.8% in 1997–2001 to 2.6% in 2001–2008.
In terms of psychotropic medication classes, the data revealed that the average annual rate of spending on antidepressants slowed from 18% in 1997–2001 to 2% in 2001–2008 (Table 1). The rate slowed from 34% to 17% for antipsychotics and from 20% to 5% for anxiolytics, sedatives, and hypnotics. The growth rate for spending on ADHD medications, or stimulants, however, increased from 7% to 21%.
Decomposing the MarketScan data revealed that the largest sources of the decline in spending growth for psychotropic medications was lower growth in the cost per day supplied and the percentage of the population using psychotropic medications (Table 1). The average annual growth rate in the percentage of the population using psychotropic medications declined from 7% in 1997–2001 to 2% in 2001–2008. The average annual growth rate in costs per day supplied declined from 8% to 2%. The average annual growth rate in days supplied per user declined only slightly, from 3% to 2%.
By dividing the difference in the growth rate in costs per day in 1997–2001 and 2001–2008 (5.9%) by the total difference in the overall growth rate (11.3%), we calculated that 49% of the total decline in the growth rate stemmed from the decline in growth of costs per day. Another 40% was attributable to the decline in the growth rate of users in the population (4.6%), and 11% was attributable to a decline in growth in days supplied per user (1.2%) (data not shown).
Growth in percentage of users in the population dropped most precipitously for antidepressants, but it also fell for antipsychotics and for anxiolytics, sedatives, and hypnotics. The growth in the percentage of users in the population increased for ADHD medications. The growth in costs per day also fell for antidepressants, antipsychotics, anxiolytics, sedatives, hypnotics, and ADHD medications.
Pricing and generic drug entry
The decline in the cost per day supplied of psychotropic medications can be attributed to increasing entry and use of generic equivalents of psychotropic medications. The MarketScan data indicated that in 1997, a total of 64% of all psychiatric prescriptions filled were for branded products and 36% were for generic products. By 2008, only 30% of all psychiatric prescriptions filled were for branded products and 70% were for generic products. On average, the cost of a generic medication is 80% to 85% lower than the branded product (9). In the past decade, many antidepressants became available in generic formulations, and by 2009 nearly all were generically available. Among the newer-generation (atypical) antipsychotics, two were available in generic formulation by 2009. Because antidepressants and antipsychotics account for the bulk of psychiatric drug spending, reductions in their costs naturally reduce the growth in costs per day supplied of psychotropic medications. [A table listing brand approval and generic entry of psychotherapeutic medications between 2000 and 2008 is available in an online appendix to this report at ps.psychiatryonline.org.]
Use of psychotropic medications
Analyses of MarketScan data also indicated that the number of users of psychotropic medications increased rapidly between 1997 and 2001 and subsequently grew much more slowly. From 1997 to 2001, the proportion of the population who used a psychiatric medication grew from 13% to 17%. From 2001 to 2008, it grew from 17% to 19%.
MEPS data showed a similar trend for the noninstitutionalized U.S. population for all types of insurance (Figure 3). According to the MEPS, the percentage of the population who used any psychotropic medications grew from 9.7% to 12.2% between 1997 and 2001 and from 12.2% to 13.5% between 2001 and 2007. Similarly, according to MEPS there was a slowdown in the rate of increase of the population who used antidepressants. In absolute numbers, the MEPS indicated that the population who used any psychiatric drugs grew by 8.5 million, from 26.3 to 34.7 million users, between 1997 and 2001, and by 5.8 million, to 40.6 million users, between 2001 and 2007.
Discussion
Although use of psychotropic medications experienced tremendous growth during the late 1990s and early 2000s, the rate of growth declined steadily from 2001 through 2008. The major drivers of the decline in spending growth were a decline in the average cost per day of psychotropic medications and a decline in the growth rate of users. Several underlying factors may have contributed to these trends.
Decline in average prices
The entry of generic products—particularly antidepressants, which constitute the largest share of psychotropic medications in terms of number of prescriptions—was a major contributor to the declining growth rate of medication prices. The growth of generic medications, in turn, was encouraged by new health insurance benefit designs such as tiered copayments, step therapy, and prior authorization, that were intended to steer enrollees to less costly treatments.
According to the Kaiser employer health benefit survey, in 2000, 22% of employer insurance plans had procedures for equivalent reimbursement regardless of type of drug, and only 27% had three tiers of copayment or coinsurance (the highest number of tiers reported) (10). By 2010, only 5% of plans had equivalent payments across prescription drug coverage, and 78% had three or more payment tiers. In 2010, the average copayment for tier 1 drugs, typically generics, was $11, and the average copayment for tier 3 drugs was $49. As with all medications, when psychotropic medications become generic, the generic version is placed on tier 1 and the brand version on tier 2 or 3. Consumers react to this shift by decreasing their use of tier 3 medications and by increasing their use of tier 1 medications (11,12.)
Decline in growth of users
Several factors may have affected the reduced growth in the percentage of the population using psychotropic medications. Drug safety concerns that have resulted in black-box warnings on drug labels may have led to downward pressure on psychiatric drug utilization. Several warnings have recently been issued for psychotropic medications, and research suggests that they have resulted in declines in prescription fills. For example, in 2005, after the FDA issued a black-box warning that antidepressants could be associated with suicidal behavior of children under 18 years old, antidepressant prescriptions for that patient group dropped nearly 20% (13).
Two black-box warnings were also published for second-generation antipsychotic agents because of their association with risk of weight gain and the development of diabetes and risk of sudden death for older patients with dementia (14–16). Researchers found that sales of olanzapine, the market leader, declined by 3% after publication of the risk of diabetes (17,18). Other research has found that the FDA advisory on the use of second-generation antipsychotics among elderly patients with dementia was associated with a decline in antipsychotic usage (19). However, because most black-box warnings focus on specific populations-such as the elderly, children, and those at higher risk of diabetes, it is unclear whether the magnitude of the effect was large enough to drive significant declines in utilization growth rates.
The slowdown in the introduction of new medications may have also contributed to slower utilization growth. Compared with the 1990s, the first decade of the 21st century witnessed entry of fewer new antidepressants. Only three antidepressants entered the market from 2000 to 2009: Lexapro was approved in 2002 and was generically available by 2006; Emsam, a transdermal patch, was approved in 2006; and Pristiq was approved in 2008. In contrast, several new antipsychotics were approved, including Geodon in 2001, Abilify in 2002, Risperdal Consta in 2003, Invega in 2007, Invega Sustenna in 2007, Fanapt in 2009, and Saphris in 2009. [Approval dates and dates of entry for generic equivalents of antidepressants and antipsychotics are available in an online appendix to this report at ps.psychiatryonline.org.]
In addition, in recent years several antipsychotics received FDA approval for additional indications beyond schizophrenia—for bipolar disorder and depression—and there is evidence that antipsychotics are used for off-label conditions such as dementia. Despite the entry of new antipsychotics, overall utilization growth declined; the decline is most likely explained by the fact that antidepressants are much more widely used than antipsychotics.
Implications of spending trends
The decline in psychiatric spending growth may have both positive and negative implications. Because of generic entry, consumers can now purchase psychotropic medications at a lower price, opening the possibility of improved access to these medications. In years past, concerns by third-party payers about rising prices for psychiatric drugs (20) led Medicaid and commercial insurers to implement more restrictive benefit designs to encourage utilization of lower-cost medications. Although these benefit designs have been found to reduce medication expenditures, some research suggests they may make it harder for patients to obtain a psychiatric medication and lead to worse mental health outcomes.
For example, a recent study found that antidepressant step therapy was associated with fewer antidepressant fills and more hospitalizations and emergency department visits (21). Similarly, other studies have found that prior authorization and tiered formularies may present access barriers to the appropriate use of psychotropic medications (11, 22–27). Now that more products are available in generic formulations, more psychotropic medications may receive preferential tier 1 coverage, and patients may face fewer formulary restrictions.
On the negative side, the availability of a broad range of psychotropic medications within each major class coupled with significant generic penetration may serve to diminish the financial return to the pharmaceutical industry from drug development and create a disincentive to bring new medications to market. The effect of generic entry on innovation in the pharmaceutical sector remains controversial and uncertain (28–30), but there has been concern that pharmaceutical companies have reduced their investment in psychiatric drug research and development (31).
Yet, many psychotropic medications have much room for improvement in efficacy, rate of onset of action, and tolerability (32). Whether new products that address the limitations are brought to market remains to be seen.
This study must be understood in light of its limitations. It relied on several different data sets to analyze prescription drug trends. None of the data sets was ideal and each had its strengths and limitations. The SAMHSA spending estimates had the advantage of reaching back almost 20 years, to 1986; however, SAMHSA's most current estimates extended only to 2005. Moreover, the data were aggregated over the U.S. population and cannot be decomposed to reflect changes in utilization and price.
The MarketScan data covered only individuals with private insurance and thus may have not adequately captured trends in prescribing in the public sector. However, the data set covered millions of enrollees—the most recent data represented about 30 million enrollees, or 10% of the U.S. population. Some contributors to the MarketScan database changed over time, but we do not believe that those changes had a significant impact on the trends found in our analyses. In fact, we compared the growth rate for psychotropic medication use during the 2002–2009 period for only entities who contributed to the database during the whole time period and for all contributors to the data base and found very similar growth rate patterns. [Details on psychotropic prescription growth rates among Marketscan contributors is available in an online appendix to this report at ps.psychiatryonline.org.]
It should also be noted that the MarketScan data have been used for a number of published studies of trends in spending and utilization because they represent an extremely large and geographically and demographically diverse population.
Conclusions
Rapidly accelerating drug costs understandably are a concern to health insurance payers and purchasers. The response to those rising costs may be better informed by an analytic perspective that decomposes the causes of higher costs. In the case of psychotropic medications, the high growth in spending during the late 1990s and into the early years of the next decade appears to have been a temporary phenomenon fueled by the introduction of new medications still on patent as well as by the rising use of those medications.
1 : National Expenditures for Mental Health Services and Substance Abuse Treatment, 1993–2003. DHHS pub no SMA 07-4227. Rockville, Md, Substance Abuse and Mental Health Services Administration, 2007 Crossref, Google Scholar
2 : What drove private health insurance spending on mental health and substance abuse care, 1992–1999? Health Affairs 22(1):165–172, 2003 Crossref, Google Scholar
3 : Prescription drugs and the changing patterns of treatment for mental disorders, 1996–2001. Health Affairs 24(1):195–205, 2005 Crossref, Google Scholar
4 : Trends in mental health cost growth: an expanded role for management? Health Affairs 28:649–659, 2009 Crossref, Google Scholar
5 : National Expenditures for Mental Health Services and Substance Abuse Treatment, 1986–2005. DHHS pub no SMA 10-4612. Rockville, Md, Substance Abuse and Mental Health Services Administration, 2010 Google Scholar
6 : Changes in US spending on mental health and substance abuse treatment, 1986–2005, and implications for policy. Health Affairs 30:284–292, 2011 Crossref, Medline, Google Scholar
7 : Health Research Data for the Real World: The Thomson Reuters MarketScan Databases. Washington, DC, Thomson Reuters, 2010. Available at www.marketscan.thomsonreuters.com/marketscanuniversity/publications.aspx. Accessed
8 : For what diagnoses are psychotropic medications being prescribed? A nationally representative survey of physicians. CNS Drugs 24:319–326, 2010 Crossref, Medline, Google Scholar
9 Facts and Myths About Generic Drugs. Silver Spring, Md, US Food and Drug Administration, 2009. Available at www.fda.gov Google Scholar
10 Employer Health Benefits 2010 Annual Survey. Menlo Park, Calif, and Chicago, Kaiser Family Foundation and Health Research and Educational Trust, 2010. Available at www.ehbs.kff.org/pdf/2010/8085.pdf Google Scholar
11 : The effect of a three-tier formulary on antidepressant utilization and expenditures. Journal of Mental Health Policy and Economics 11:67–77, 2008 Medline, Google Scholar
12 : The effects of prescription drug cost sharing: a review of the evidence. American Journal of Managed Care 11:730–740, 2005 Medline, Google Scholar
13 : Antidepressants and suicide risk: how did specific information in FDA safety warnings affect treatment patterns? Psychiatric Services 61:11–16, 2010 Link, Google Scholar
14
15
16 : The Dementia Antipsychotic Withdrawal Trial (DART-AD): long-term follow-up of a randomized placebo-controlled trial. Lancet Neurology 8:151–157, 2009 Crossref, Medline, Google Scholar
17 : Lilly ferociously defends its top seller. Forbes.com, Sep 9, 2004. Available at www.forbes.com Google Scholar
18 : Elderly patients with dementia-related symptoms of severe agitation and aggression: consensus statement on treatment options, clinical trials methodology, and policy. Journal of Clinical Psychiatry 69:889–898, 2008 Crossref, Medline, Google Scholar
19 : Impact of FDA black box advisory on antipsychotic medication use. Archives of Internal Medicine 170:96–103, 2010 Crossref, Medline, Google Scholar
20 : Rising costs prompt states to reduce Medicaid further. New York Times, Sep 23, 2003 Google Scholar
21 : The effects of antidepressant step therapy protocols on pharmaceutical and medical utilization and expenditures. American Journal of Psychiatry 167:1202–1209, 2010 Link, Google Scholar
22 : Impact of 3-tier formularies on drug treatment of attention-deficit hyperactivity disorder in children. Archives of General Psychiatry 62:435–441, 2005 Crossref, Medline, Google Scholar
23 : Effect of a medication copayment increase in veterans with schizophrenia. American Journal of Managed Care 13:335–346, 2007 Medline, Google Scholar
24 : Medicaid prescription drug policies and medication access and continuity: findings from ten states. Psychiatric Services 60:601–610, 2009 Link, Google Scholar
25 : Prior authorization for antidepressants in Medicaid: effects among disabled dual enrollees. Archives of Internal Medicine 169:750–756, 2009 Crossref, Medline, Google Scholar
26 : Effects of prior authorization on medication discontinuation among Medicaid beneficiaries with bipolar disorder. Psychiatric Services 60:520–527, 2009 Link, Google Scholar
27 : Unintended impacts of a Medicaid prior authorization policy on access to medications for bipolar illness. Medical Care 48:4–9, 2010 Crossref, Medline, Google Scholar
28 : How Increased Competition From Generic Drugs Has Affected Prices and Returns in the Pharmaceutical Industry. Washington, DC, Congressional Budget Office, 1998 Google Scholar
29 Generic Pharmaceuticals. Paris, Organization for Economic Policy and Development, Policy Roundtable, Oct, 2009 Google Scholar
30 : The effect of paragraph IV decisions and generic entry before patent expiration on brand pharmaceutical firms. Journal of Health Economics 30:126–145, 2011 Crossref, Medline, Google Scholar
31 : Who will develop the next generation of medications for mental illness? NIMH Director's Blog, Mar 30, 2010 Google Scholar
32 : The future of psychopharmacology of depression. Journal of Clinical Psychiatry 71:971–975, 2010 Crossref, Medline, Google Scholar
Figures and Tables
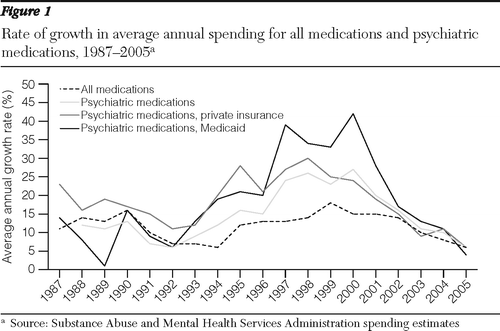
Figure 1 Rate of growth in average annual spending for all medications and psychiatric medications, 1987–2005
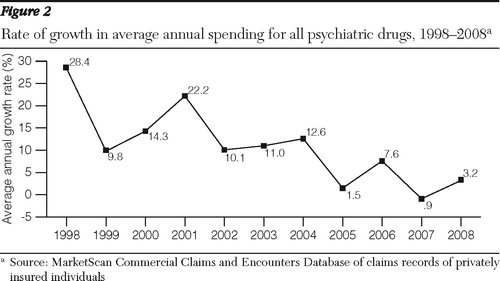
Figure 2 Rate of growth in average annual spending for all psychiatric drugs, 1998–2008
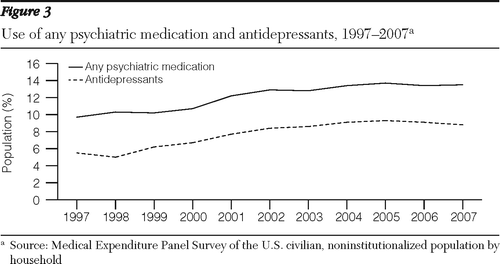
Figure 3 Use of any psychiatric medication and antidepressants, 1997–2007
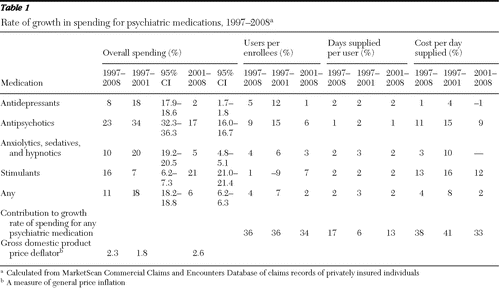
Table 1 Rate of growth in spending for psychiatric medications, 1997–2008

