National Variation of ADHD Diagnostic Prevalence and Medication Use: Health Care Providers and Education Policies
Attention-deficit hyperactivity disorder (ADHD) is one of the most common childhood mental health disorders in the United States. As of 2003, 4.4 million (7.8%) children aged four to 17 were estimated to have a diagnosis of ADHD ( 1 ). Children with this disorder often face long-standing problems with academic achievement, social relationships, life skills, risk of injury, and functional independence ( 2 , 3 , 4 , 5 ). Stimulant medications have been found to yield important behavioral improvements for children in this diagnostic category ( 6 ). In 2003 an estimated 56% of children diagnosed as having ADHD in the United States were taking medication for this condition ( 1 ), at a cost of $2.2 billion ( 7 ). Although medication side effects are typically mild and manageable (associated with appetite and sleep patterns), there is potential for cardiovascular problems ( 8 ) and inhibited physical growth ( 9 ) as well as inappropriate use by nondiagnosed individuals for cognitive enhancement or recreational purposes ( 10 ).
Given the benefits of and concerns about medication use, it is essential that ADHD be appropriately diagnosed among children and that they receive appropriate medication when indicated. Notably, findings from national studies point to some variation in diagnostic prevalence and medication rates across geographic regions. It is therefore important to identify the factors that contribute to such variation, many of which have policy relevance at the state level.
Prior studies using multivariate approaches to estimate ADHD-related variation across regions have yielded mixed results. One study found lower diagnostic prevalence in the West versus the Midwest regions of the United States, but results for the South varied across model specifications ( 11 ). Another investigation did not find regional differences in whether an ADHD diagnosis was given during a visit to a physician or to a hospital outpatient department ( 12 ). Regarding medication use among children diagnosed as having ADHD, one study found more medication use in the West and South versus the Northeast ( 12 ), but an earlier study found more medication use in the South versus the West ( 13 ). These studies did not analyze state-level variation.
Aside from demographic differences, regional variation is likely to be influenced by several factors, including health and education systems ( 14 ). Yet these factors have not been analyzed together. Physicians and psychologists are typically responsible for the formal diagnosis and treatment of ADHD, but the number, ages, and types of these health care providers vary across states. A national study that used county-level medication data found that high-use counties were marked by more physicians per capita and a higher ratio of younger to older physicians ( 15 ).
Before and after the passage of the No Child Left Behind Act of 2001, states implemented standards-based reform strategies that linked accountability systems to student achievement benchmarks, placing greater focus on low-performing students ( 16 , 17 ). Because children affected by ADHD often have low academic achievement ( 18 ), state variation in accountability systems may be linked to diagnostic prevalence and medication use. An investigation revealed that state-level school accountability policies were positively associated with a child's diagnosis, but data were not available concerning medication ( 11 ).
Because of concern regarding overmedication, including the potential for school personnel to become overly influential in recommending medication treatment for children with ADHD, nine states have passed legislation since 2001 and an additional 14 states have introduced legislation (hereafter referred to as "ADHD laws") that reduces the influence of school personnel regarding medication decisions or strengthens parental rights in such decisions ( 19 , 20 ). One study did not find an association between ADHD laws and diagnostic prevalence as of spring 2002, yet the investigation occurred just after initial state ADHD laws were passed ( 11 ).
Overall, evidence of regional differences in ADHD diagnostic prevalence and medication use is inconsistent, and state-level data have not been evaluated with a multivariate approach. Thus we used the largest and most recently available nationally representative data set to estimate variation in diagnostic prevalence and medication rates across census regions, to estimate parallel variation across states, and to examine whether state-level health care provider characteristics and education policies were associated with state-level variation.
Methods
To determine how diagnostic prevalence and medication rates varied with controls for demographic differences across geographical areas, we estimated two logistic regression models. In the first, the dependent variable indicated whether a doctor or health care professional had ever told the respondent (usually the child's parent or guardian) that the child had attention-deficit disorder or ADHD (hereafter, we refer to both conditions as simply ADHD). In the second, the dependent variable indicated whether the respondent reported that the child was taking medication for this condition at the time of the survey; this model included only children reported as having an ADHD diagnosis.
In both models, similar to other ADHD investigations ( 11 , 12 , 13 ), independent variables included child's sex, age, race, health insurance status, and schooling status; family parental structure; number of children in the household; household income; highest level of education attained in the household; and geographic variables, by either census region or state. When census regions were used, West was the reference region. When states were used, to improve the interpretability of the results, we used an analytic technique that allowed comparison of the odds of being diagnosed (or taking medication) in a state versus the United States as a whole. Although the comparison state was within the United States as a whole, its influence on the nation's diagnostic prevalence and medication rate was minimal because all 50 states and the District of Columbia were included. In this approach, each state was represented by a dummy variable, and the model was constrained so that the sum of the state dummy parameter estimates was zero ( 21 ). This approach did not affect the statistical estimates of the nongeographical variables.
To examine state-level factors that may be associated with whether a child is diagnosed as having ADHD or is taking medication for it, we re-estimated the models described above by including the following variables: number of physicians and psychologists per 10,000 children in each state, state-level school accountability policies, and whether a child resided in Connecticut, Illinois, or Virginia—the states that had enacted an ADHD law before 2003. Per-student expenditures by state were included because they are related to education system quality and likely to influence special education resources ( 22 ). Because of the inclusion of these state-level variables, the state dummy variables for these latter analyses were removed and replaced with census division dummy variables.
The child-level data are from the largest and most recently available survey on children, the 2003 National Survey of Children's Health (NSCH), which included 102,353 children, of whom 79,697 were aged four to 17. The NSCH is a telephone survey that was conducted by the Centers for Disease Control and Prevention between January 2003 and July 2004 ( 23 ). The state-stratified survey was administered to adults living in the United States within a household with one or more children aged 17 or under. Informed consent was obtained from each adult respondent with the use of approved procedures. Data were collected from the adult respondent about the child's physical and emotional health, utilization of health care services, and demographic characteristics. Because of missing data (addressed later in the Discussion section), our analytic sample included 69,505 children.
Our source for health care provider data was the Area Resource File ( 24 ). Health care providers who treat children who have ADHD primarily include pediatricians, family and general practitioners, child psychiatrists, and psychologists ( 25 , 26 ). Psychiatrists and neurologists also treat children with ADHD, but to a lesser extent ( 25 , 27 ); therefore, they were included only in our sensitivity analysis models. Following the methods of Schneider and Eisenberg ( 11 ), we based our analyses on the state-level school accountability policies listed in the Education Counts database ( 28 ). Expenditures per student were from the National Education Association ( 29 ).
To take into account the complex survey design of the NSCH, we used Stata 9.2 ( 30 ) for all analyses.
Results
The ADHD and demographic variables from our NSCH sample are presented in Table 1 .
 |
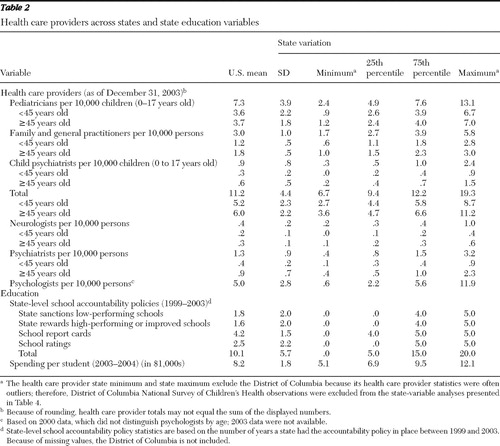
Table 2 shows the number of health care providers and education variable values for the United States and their variation across states. The health care provider statistics are reported per 10,000 persons (or per 10,000 children aged 0 to 17 when a provider primarily sees children).
 |
We first estimated diagnosis and medication models with the demographic and census region variables. Compared with the West, diagnostic prevalence in the South was higher (odds ratio [OR]=1.42, p<.001). Compared with the West, the medication rate among children with ADHD was higher in both the South (OR=1.60, p<.01) and the Midwest (OR=1.53, p<.01) and approached being significantly higher (OR=1.40, p=.06) in the Northeast.
Table 3 shows the results of the diagnosis and medication models with demographic and state variables. The demographic variable associations are consistent with the multivariate findings of a previous study that analyzed medication use with the NSCH ( 31 ). We highlight the state results, which differed from the previously reported crude rates ( 1 ). The state results were sorted by the diagnosis odds ratio, and the five states with a diagnostic prevalence lower than that of the United States as a whole included not only Western states (Colorado and Utah) but also Vermont, South Dakota, and Nebraska. Eight of the nine states with a diagnostic prevalence higher than that of the United States as a whole were in the South; the other was Michigan.
 |
The five states with a medication rate lower than the U.S. rate included not only Western states (California and Nevada) but also Connecticut, New Jersey, and Kentucky. No state had a medication rate that was higher than that for the United States, although Texas and Delaware were higher at the .10 level.
For Figure 1 we used the results in Table 3 to plot each state's odds ratio for diagnosis (horizontal axis) and medication (vertical axis) of ADHD. As expected, Southern states constitute a majority of the states located in the quadrant indicating above-average diagnostic prevalence plus above-average medication rate (upper right), whereas Western states constitute a majority of the states in the quadrant indicating below-average diagnostic prevalence plus below-average medication rate (lower left).

To aid interpretation, we translated the odds ratios into probabilities using a boy and girl between age nine and 13 with the most common characteristics in the sample (see Table 1 ). The predicted diagnostic prevalence for the boy and girl for the United States was 10.7% and 4.1%, respectively, and the state diagnostic prevalence ranged from 6.9% and 2.6%, respectively, in Vermont to 14.5% and 5.7%, respectively, in Maryland. The predicted national medication rate for the diagnosed boy and girl defined above was 74.1% and 73.4%, respectively, and the medication rate among states ranged from 56.7% and 56.2%, respectively, in California to 81.9% and 81.5%, respectively, in the District of Columbia.
Table 4 shows the results of our state-level variable analyses. When we aggregated pediatricians, family and general practitioners, and child psychiatrists into a single group and included them within the diagnosis and medication models, we found no associations. We then separated this group into six ten-year age groups to understand the influence of provider age. On the basis of this examination, we grouped the providers by those below 45 years of age and those 45 years of age or older (hereafter "younger" and "older" providers, respectively). We still did not find an association between providers and a child's being diagnosed (model 1). However, we found a positive association between the number of younger providers and diagnosed children taking ADHD medication (OR=1.25, p<.01), but the parallel association was negative with the number of older providers (OR=.85, p<.05) (model 3). When psychiatrists and neurologists were also included within the two provider groups, the significance of these results did not change.
 |
We then also separated the providers by specialty. An increase in the number of younger pediatricians approached being negatively associated with a child's diagnosis (OR=.89, p=.06), while an increase in the number of older pediatricians approached being positively associated with a child's diagnosis (OR=1.12, p=.06) (model 2). The difference between these two odds ratios was significant (p<.05). The difference between the parallel odds ratios predicting medication use among diagnosed children was also significant (p<.05); however, the odds ratio for younger pediatricians (OR=1.18, p=.18) was greater than the odds ratio for older pediatricians (OR=.75, p<.05) (model 4). Moreover, older pediatricians' association with a child's being diagnosed (OR=1.12 p=.06) significantly differed with the parallel association for family and general practitioners (OR=.74, p<.05) (model 2).
To aid in the interpretation of these odds ratios, we show a result in probability units using the following example. Consider a boy between ages nine and 13 with ADHD and having the most common characteristics in the sample. Consider also that the state-level and census division variables are at their means. An increase in the number of older pediatricians from 3.7 per 10,000 children (the U.S. mean) to 4.7 per 10,000 in a state decreases his probability of being on ADHD medication from 73% to 67%. For the boy's female counterpart, the decrease would be from 72% to 66%.
The state-level school accountability policies were not associated with a child's being either diagnosed or on medication (models 2 and 4, which are the preferred models because they incorporated provider type). We tested several specifications, including discretely including each accountability type, aggregating across types, and coding the number of years an accountability policy had been in place during the previous five years, which accounts for implementation time. ADHD laws were not associated with a child's diagnostic status; however, the laws approached being negatively associated with a diagnosed child's being on ADHD medication (OR=.72, p=.08) (model 4).
Discussion
The primary findings show that ADHD diagnostic prevalence was higher in the South than in the West, and among children with ADHD, medication use was higher in the South and the Midwest than in the West. Several states had a diagnostic prevalence or medication rate that differed from the U.S. averages. Second, having a diagnosis of ADHD or taking medication for it was associated with the number, age, and type of physicians within a state, particularly pediatricians. Third, state-level school accountability policies were not found to be associated with ADHD diagnosis or taking medication for ADHD, but ADHD laws concerning a school's influence in recommending medication use approached being negatively associated with diagnosed children's taking ADHD medication.
Although we discovered states that had a diagnostic prevalence or medication rate that differed from the U.S. averages, we do not conclude that they are states that under- or overdiagnose children or that under- or overmedicate children who have an ADHD diagnosis. Unfortunately, the United States still lacks a diagnostic prevalence estimate that is generated from clinicians evaluating a representative sample of children for ADHD. Furthermore, there is no objective test for a diagnosis of ADHD, as is the case with other mental disorders. A key question pertains to whether the diagnosis involves symptoms per se or whether some indicators of impairment are included. Also, without knowing the true diagnostic prevalence, the optimal medication rate is difficult to determine, because these two measures are likely to be linked.
Still, our results are important because they show geographic variation in diagnostic prevalence that is likely higher than the "true" variation that would be revealed from clinicians' use of an objective standard to evaluate geographically representative samples of children for ADHD. Therefore, it is important to investigate factors that influence diagnostic prevalence as well as medication use. Thus we discuss the health provider characteristics in the states that not only had a diagnostic prevalence or medication rate that differed from the U.S. averages but also did not align with regional diagnostic prevalence and medication rate patterns.
The high diagnostic prevalence in Michigan is consistent with findings from a previous study ( 32 ). Older age of family practitioners and of general practitioners was negatively associated with a child's being diagnosed, and the number of these older practitioners per 10,000 persons in Michigan (1.4) is lower than the U.S. average (1.8), even though Michigan's number of younger practitioners is similar to the U.S. average.
The number of older pediatricians per 10,000 children in South Dakota (1.2) and Nebraska (2.1) was less than the U.S. average (3.7), and their ratios of older to younger pediatricians were also less than the U.S. average, all of which may have contributed to their lower diagnostic prevalences.
On the other hand, the number of older pediatricians per 10,000 children was significantly higher in Connecticut (5.7) and New Jersey (6.3) compared with the U.S. average (3.7), and their ratios of older to younger pediatricians were also higher than the U.S. average. These factors may contribute to the lower medication rates in these states; moreover, Connecticut was the first state to enact an ADHD law in 2001.
The associations of diagnostic prevalence and medication use with physician characteristics are noteworthy; they may result from factors such as differences in education and training, referral practices, and patient case mix. The positive association between the number of older pediatricians and diagnosing ADHD is consistent with a 2004 national survey of pediatricians ( 33 ). Our finding of a negative association between the number of older pediatricians and a diagnosed child's taking ADHD medication may relate to these pediatricians' having little, if any, medical school education about the use of ADHD medications. Also, the American Board of Pediatrics does not have a recertification requirement for pediatricians certified before 1988.
The finding of a negative association between a child's being diagnosed with ADHD and the number of older family and general practitioners may reflect practitioners' referral of children to other professions for ADHD evaluation because of a lack of training, as found in Minnesota ( 34 ), but more research is needed nationally.
The finding that the number of older child psychiatrists was positively associated with a diagnosed child's taking ADHD medication is not easy to interpret. For example, it is not clear whether psychiatrists' case mix was similar to that in primary care ( 35 ) or included children with more impairing ADHD who had a greater number of comorbid conditions ( 36 ). Also, the differences in medication practice between child psychiatrists and pediatricians need to be further studied ( 37 ).
In summary, to better understand the association between a state's health care provider characteristics and both diagnostic prevalence and medication use, it may be fruitful to examine the content of provider continuing education programs, including the recommendations of major health professional organization guidelines to treat ADHD ( 38 , 39 , 40 , 41 ), which primarily differ regarding the extent to which medication should be used to treat ADHD, especially over long periods. Studying ADHD-related referrals and patient case mix among provider specialties could be informative as well.
State-level school accountability policies were not associated with ADHD diagnosis or medication for it. The state ADHD laws also were not associated with diagnosis, but findings suggest that these laws are associated with less medication use. Because the laws were enacted just before the NSCH data were collected, these findings serve as a baseline measure for future studies.
Three limitations of the study warrant discussion. First, the NSCH telephone survey response rate was 55.3%; however, sampling weights were adjusted for nonresponse. Our analytic sample excluded 14% of the observations, primarily because of missing household income data. However, the excluded observations were not concentrated within a few particular states: exclusion rates by state ranged from 9.1% to 17.5% (and the rate was 19.9% in the District of Columbia).
Second, information on both ADHD diagnosis and medication status was determined by reports from adult respondents. This procedure could introduce measurement error, because some children with ADHD may have never received a diagnosis, and respondent reports may be influenced by stigma or recall bias. Future studies should investigate whether this potential measurement error explains any of the state-level diagnosis and medication variation.
Third, the NSCH lacked variables that may explain some of the variation, including ADHD subtype, degree of impairment of the ADHD symptoms, and whether the child received behavioral treatment for ADHD. Future surveys should include questions to capture these variables.
Conclusions
This study constitutes one step toward improving the diagnosis and treatment of children with ADHD. Although we did not conclusively identify states that under- or overdiagnose children or that under- or overmedicate children diagnosed as having ADHD, our results point to areas where additional research should be conducted, particularly for better understanding the reasons that provider characteristics are associated with diagnostic prevalence and medication use. Further investigation could help children with ADHD to have a better chance of achieving academic and social parity with their peers.
Acknowledgments and disclosures
This study was funded by a National Institute of Mental Health grant R01-MH067084. The authors are grateful to Teh-wei Hu, Ph.D., for his participation and technical contributions to our study group. The authors thank Tim-Allen Bruckner, Ph.D., for his thoughtful comments on a draft of this article.
The authors report no competing interests.
1. Centers for Disease Control and Prevention: Mental health in the United States: prevalence of diagnosis and medication treatment for attention-deficit/hyperactivity disorder—United States, 2003. Morbidity and Mortality Weekly Report 54:842–847, 2005Google Scholar
2. Currie J, Stabile M: Child mental health and human capital accumulation: the case of ADHD. Journal of Health Economics 25:1094–1118, 2006Google Scholar
3. Barkley RA (ed): Attention-Deficit Hyperactivity Disorder: A Handbook for Diagnosis and Treatment, 3rd ed. New York, Guilford, 2006Google Scholar
4. Nigg JT: What Causes ADHD? New York, Guilford, 2006Google Scholar
5. Hinshaw SP: Is ADHD an impairing condition in childhood and adolescence? in Attention-Deficit Hyperactivity Disorder: State of the Science, Best Practices. Edited by Jensen PS, Cooper JR. Kingston, NJ, Civic Research Institute, 2002Google Scholar
6. MTA Cooperative Group: Fourteen-month randomized clinical trial of treatment strategies for attention-deficit hyperactivity disorder. Archives of General Psychiatry 56:1073–1086, 1999Google Scholar
7. Scheffler RM, Hinshaw SP, Modrek S, et al: The global market for ADHD medications. Health Affairs 26:450–457, 2007Google Scholar
8. Paykina N, Greenhill LL: Pharmacological treatments for attention-deficit/hyperactivity disorder; in A Guide to Treatments That Work. Edited by Nathan PE, Gorman JM. New York, Oxford University Press, 2007Google Scholar
9. Swanson JM, Elliott GR, Greenhill LL, et al: Effects of stimulant medication on growth rates across 3 years in the MTA follow-up. Journal of the American Academy of Child and Adolescent Psychiatry 46:1015–1027, 2007Google Scholar
10. Sahakian B, Morein-Zamir S: Professor's little helper. Nature 450:1157–1159, 2007Google Scholar
11. Schneider H, Eisenberg D: Who receives a diagnosis of attention-deficit/hyperactivity disorder in the United States elementary school population? Pediatrics 117:601–609, 2006Google Scholar
12. Stevens J, Harman JS, Kelleher KJ: Ethnic and regional differences in primary care visits for attention-deficit hyperactivity disorder. Developmental and Behavioral Pediatrics 25:318–325, 2004Google Scholar
13. Hoagwood K, Jensen PS, Feil M, et al: Medication management of stimulants in pediatric practice settings: a national perspective. Developmental and Behavioral Pediatrics 21:322–331, 2000Google Scholar
14. Jensen PS, Cooper JR (eds): Attention-Deficit Hyperactivity Disorder: State of the Science, Best Practices. Kingston, NJ, Civic Research Institute, 2002Google Scholar
15. Bokhari F, Mayes R, Scheffler RM: An analysis of the significant variation in psychostimulant use across the US. Pharmacoepidemiology and Drug Safety 14:267–275, 2005Google Scholar
16. Betts J, Costrell RM: Incentives and equity under standards based reform; in Brookings Papers of Education Policy. Edited by Ravitch D. Washington, DC, Brookings Institution, 2001Google Scholar
17. Heubert J, Hauser RM: High Stakes Testing for Tracking, Promotion, and Retention. Washington, DC, National Research Council, 1999Google Scholar
18. Hinshaw SP: Externalizing behavior problems and academic underachievement in childhood and adolescence: causal relationships and underlying mechanisms. Psychological Bulletin 111:127–155, 1992Google Scholar
19. AACAP State Psychotropic Medication and Screening Update. Washington, DC, American Academy of Child and Adolescent Psychiatry, Oct 2005. Available at www.aacap.org/galleries/LegislativeAction/psychotropicMeds_102005.pdf Google Scholar
20. Child labeling and drugging bills and resolutions passed. Available at ablechild.org/slegislation.htm . Accessed July 10, 2008 Google Scholar
21. Suits DB: Dummy variables: mechanics v interpretation. Review of Economics and Statistics 66:177–180, 1984Google Scholar
22. Hedges LV, Laine RD, Greenwald R: An exchange: part 1: does money matter? A meta-analysis of studies of the effects of differential school inputs on student outcomes. Educational Researcher 23:5–14, 1994Google Scholar
23. Blumberg SJ, Olson L, Frankel MR, et al: Design and Operation of the National Survey of Children's Health, 2003. Hyattsville, Md, Centers for Disease Control and Prevention, National Center for Health Statistics, Mar 1, 2005Google Scholar
24. Area Resource File Technical Documentation. Washington, DC, National Center for Health Workforce Analysis, 2005Google Scholar
25. Zito JM, Safer DJ, dosReis S, et al: Psychotherapeutic medication patterns for youths with attention-deficit/hyperactivity disorder. Archives of Pediatric and Adolescent Medicine 153:1257–1263, 1999Google Scholar
26. Olfson M, Gameroff MJ, Marcus SC, et al: National trends in the treatment of attention deficit hyperactivity disorder. American Journal of Psychiatry 160:1071–1077, 2003Google Scholar
27. Zarin DA, Tanielian TL, Suarez AP, et al: Treatment of attention-deficit hyperactivity disorder by different physician specialties. Psychiatric Services 49:171, 1998Google Scholar
28. Education Counts (database). Bethesda, Md, Editorial Projects in Education. Available at www.edcounts.org/createtable/step1.php?categoryId=31 . Accessed Nov 6, 2008 Google Scholar
29. State by State—Per Pupil Expenditures. Washington, DC, National Conference of State Legislatures. Available at www.ncsl.org/print/educ/PerPupilExpenditures.pdf Google Scholar
30. Statistical Software, release 9.0. College Station, Tex, StataCorp, 2005Google Scholar
31. Visser SN, Lesesne CA, Perou R: National estimates and factors associated with medication treatment for childhood attention-deficit/hyperactivity disorder. Pediatrics 119(suppl):S99–S106, 2007Google Scholar
32. Rappley MD, Gardiner JC, Jetton JR, et al: The use of methylphenidate in Michigan. Archives of Pediatrics and Adolescent Medicine 149:675–679, 1995Google Scholar
33. Stein REK, Horwitz SM, Storfer-Isser A, et al: Attention-deficit/hyperactivity disorder: how much responsibility are pediatricians taking? Pediatrics 123:248–255, 2009Google Scholar
34. Daly ME, Rasmussen NH, Agerter DC, et al: Assessment and diagnosis of attention-deficit/hyperactivity disorder by family physicians. Minnesota Medicine 89:40–43, 2006Google Scholar
35. Busch B, Biederman J, Cohen LG: Correlates of ADHD among children in pediatric and psychiatric clinics. Psychiatric Services 53:1103–1111, 2002Google Scholar
36. Stein B, Orlando M: ADHD treatment in a behavioral health care carve-out: medications, providers, and service utilization. Journal of Behavioral Health Services and Research 28:30–41, 2001Google Scholar
37. Heneghan A, Garner AS, Storfer-Isser A, et al: Use of selective serotonin reuptake inhibitors by pediatricians: comparing attitudes of primary care pediatricians and child and adolescent psychiatrists. Clinical Pediatrics 47:148–154, 2008Google Scholar
38. American Academy of Pediatrics: Subcommittee on Attention-Deficit/Hyperactivity Disorder and Committee on Quality Improvement: Clinical practice guideline: treatment of the school-aged child with attention-deficit/hyperactivity disorder. Pediatrics 108:1033–1044, 2001Google Scholar
39. Practice Parameter for the Assessment and Treatment of Children and Adolescents With Attention-Deficit/Hyperactivity Disorder. Washington, DC, American Academy of Child and Adolescent Psychiatry, 2007. Available at www.aacap.org/galleries/PracticeParameters/New_ADHD_parameter.pdf Google Scholar
40. Report of the Working Group on Psychoactive Medications for Children and Adolescents: Psychopharmacological, Psychosocial, and Combined Interventions for Childhood Disorders: Evidence Base, Contextual Factors, and Future Directions. Washington, DC, American Psychological Association, APA Working Group on Psychoactive Medications for Children and Adolescents, 2006. Available at www.apa.org/pi/cyf/childmeds.pdf Google Scholar
41. Goldman LS, Genel M, Bezman RJ, et al: Diagnosis and treatment of attention-deficit/hyperactivity disorder in children and adolescents. JAMA 279:1100–1107, 1998Google Scholar