Gender Differences in the Annual Income of Psychiatrists
Women have historically earned less than men. In the United States, however, the disparity appears to be narrowing: the ratio of women's to men's median hourly wage increased from 63% in 1979 to 77% in 1999. Women's wages increased relative to men's because more women entered the workforce, fewer women received minimum wages, and the real wages of men decreased ( 1 ).
We wanted to examine whether these same trends held true for the medical profession for two reasons. First, women represent an increasingly large proportion of medical students ( 2 ) and the workforce of practicing physicians ( 3 ). Second, there is historical evidence of gender-based income disparity in primary care. Since the late 1970s female gender has been shown to be associated with lower incomes among United States physicians, even after the analysis adjusted for workload ( 4 ). More recent studies that also adjusted for physician age and specialty revealed similar income disparities ( 5 , 6 , 7 , 8 ), although one found that the combination of specialty status, personal data, and female internists' less lucrative practice arrangements eliminated income differences ( 9 ). This latter, more thorough analysis was limited to a single year and to a single state, and it did not evaluate medical subspecialties separately.
Gender disparities in incomes were found during the 1980s among psychiatrists. Data from the 1988–1989 American Psychiatric Association's Professional Activities Survey suggested that female psychiatrists earned almost $13,000 less than their male counterparts, after the analysis controlled for providers' demographic characteristics and training, practice settings, and hours worked ( 10 ); however, that study was limited by the absence of information on board certification status, which has been found to be associated with physician income ( 11 ). Since that report increasing numbers of women have entered the field of psychiatry: the proportion of women practicing psychiatry grew from 19% in 1988 to 25% in 1996 ( 12 ) and is likely to continue to grow, because 51% of U.S. psychiatric residents were women in 2003 ( 13 ). Our objective, therefore, was to use more recent data to explore the association between gender and the incomes of white psychiatrists, after adjusting for workload, practice characteristics, and provider characteristics, including board certification status, that are likely to influence physician incomes.
Methods
Study design and data
We used survey data to conduct a cross-sectional retrospective analysis of white psychiatrists' annual incomes. Because of low numbers of black respondents to the surveys, we were unable to examine the influence of race on psychiatrists' incomes. Between 1992 and 2001 the American Medical Association (AMA) conducted regular telephone surveys of physicians that collected a broad variety of individual physician-level data, including weeks and hours of practice, number of completed patient visits, provider characteristics, practice characteristics, and physician incomes ( 14 , 15 , 16 , 17 , 18 , 19 , 20 , 21 ). The survey was designed to provide representative information on the population of all actively practicing, nonfederal physicians who spend the greatest proportion of their time in patient-care activities. Weights for each respondent were calculated to correct for potential bias created by unit nonresponse and survey eligibility and to ensure that physician responders reflected the national distribution of physicians ( 21 ). This study was approved by Dartmouth Medical School's Committee for the Protection of Human Subjects.
Survey methods
Each year, the telephone-administered survey was conducted with a random sample of physicians from the AMA Masterfile who are eligible for the survey. The following physicians were excluded: doctors of osteopathy, foreign medical graduates with temporary licensure, inactive physicians, physicians sampled during the past five years, physicians on the "do not contact" list, physicians not practicing in the United States, and physicians without a license. In addition, after initial screening, federally employed physicians and physicians who spent less than 20 hours each week in patient-care activities were excluded.
The following field procedures were developed to minimize nonresponse bias: two weeks before data collection advance letters were sent describing the process and the survey, many specialty organizations provided endorsement letters, and summaries of the types of practice expenses to be reviewed were provided in advance of the survey. In addition, a minimum of four callbacks to respondents were made before abandoning interview efforts, letters encouraging participation were sent to physicians who initially refused participation, and attempts to secure participation were made by select interviewers ( 21 ).
Survey weights
Survey weights were derived by first dividing the AMA Physician Masterfile population and survey respondents into 200 cells defined by specialty, years since the respondent received an M.D. degree, AMA membership status, and board certification status. Unit response rates were constructed as the ratio of the number of physicians in the population to the number of respondents in each cell. Second, an eligibility correction was employed, because only nonfederal physicians involved in direct patient care, excluding residents, were eligible. The eligibility correction divided the subset of the population for which eligibility was known into 40 cells—according to years in practice, AMA membership status, gender, and board certification—and calculated the proportion of physicians in each cell who were eligible. This defined the eligibility weight. The overall weight applied for a given respondent was the product of the unit-response weight and the eligibility weight ( 21 ).
Sample
Although the survey had been conducted for much longer, this analysis was limited to data collected between 1992 and 2001 for two reasons. First, during the study period the survey methods allowed us to categorize physicians into well-defined specialty groups in a way that allowed for the disaggregation of responses from psychiatrists and other medical specialists. Second, these were the most recent data available for analysis, and therefore, they were likely to be the most relevant to the currently practicing physician workforce.
To ensure that all the physicians analyzed were comparable, that variables critical to the analysis were available for each respondent, and that extreme outliers did not drive results, a sequential process of elimination of survey respondents was used. First, only self-identified white physicians who were identified as practicing psychiatry in an office-based practice were included in the study, thereby eliminating a handful of black physicians and a minority of physicians who worked primarily doing research, as medical educators, as administrators, or in hospital settings. In addition, only respondents who provided information on key variables were included, and extreme outliers in annual patient visits and net incomes were excluded. This process left 740 white male and 236 white female psychiatrists available for analysis. By using survey weights, these respondents represented 709 white male and 232 white female psychiatrists.
Variables proposed to influence physician incomes
From the AMA data set, three types of independent variables that were likely to influence the dependent variable—net annual income—were extracted.
Physician workload as measured by annual hours worked. It has been demonstrated that hours worked is an important variable in analysis of physician incomes ( 5 , 6 , 7 , 8 , 22 ). Indeed, in the study sample, there was a modest linear relationship between inflation-adjusted annual physician incomes and annual hours worked (r=.42, p<.001).
Provider characteristics. When making gender comparisons of physician incomes, age has commonly been used as an adjustment factor ( 5 , 6 , 7 , 8 ). Over the working lifetime, incomes demonstrate an "inverted U" pattern ( 23 ) that typically peaks near age 55 for primary care physicians ( 24 , 25 ), or after 20 to 25 years of practicing medicine. To dispel a concern that gender might influence the age at which a physician entered medical school and therefore bias results, the number of years that respondents had been practicing medicine were incorporated into the analysis instead of physician age. In the study sample the number of years practicing medicine was highly correlated with age (r=.88, p<.001). In addition, because practice arrangements, such as having an ownership interest in the practice, has been associated with differences in annual income among physicians ( 9 ), employment status—that is, whether the physician was an employee, as opposed to a full or partial owner of the practice—was included in the analysis. Finally, because board certification has been associated with higher physician incomes ( 11 ), board certification status was also included as an independent variable in the analysis.
Practice characteristics. Physicians who live in different U.S. census regions have been shown to have modestly different annual incomes ( 14 , 15 , 16 , 17 , 18 , 19 , 20 , 21 ); therefore, information on the U.S. census region in which the practice was located was collected. In addition, because one study showed that physicians who live in poorly populated settings have lower incomes ( 26 ) and another study showed that these physicians have higher incomes ( 27 ), this analysis categorized responding physicians' county codes into three categories of metropolitan settings (less than 50,000, between 50,000 and 500,000, or greater than 500,000). Finally, because treating persons who are medically indigent and those with relatively poor insurance has been hypothesized to decrease physician incomes ( 28 ), variables likely to reflect those factors were incorporated into the analysis: whether the practice provides Medicare services and the reported proportion of patients in the practice receiving Medicaid.
Calculated and dummy variables
We used the consumer price index ( 29 ) to adjust reported net annual income to constant 2004 dollars (inflation-adjusted annual incomes). For instance, to inflate income reported for 1995 to 2004 dollars, we multiplied the reported income in 1995 by the consumer price index in 2004 (188.9) and then divided that figure by the consumer price index in 1995 (152.4). The reported number of weeks worked in the past year was multiplied by the total number of hours worked in the past week and the total number of visits seen in the past week to calculate the annual number of hours worked and the annual number of visits, respectively. Because of the inverted-U relationship between number of years practicing medicine and annual incomes, dummy variables were constructed that reflected the categorization of years practicing medicine into five-year increments, from 0 to five years practicing to 40 or more years practicing. Although these dummy variables were used in the regression analysis, they were aggregated into ten-year increments through 30 or more years practicing for the purposes of demographic comparisons.
Analysis
To determine the association between gender and physician income, after adjustment for practice and provider characteristics, we used a linear regression model that simultaneously entered the independent variables detailed above and used the annual income adjusted by the consumer price index as the dependent variable. For each independent variable we used logistic regression models to calculate dollar-denominated regression coefficients and 95% confidence intervals. For dummy variables the coefficient represents the change in annual income associated with the presence of the dummy variable, compared with a referent group or state. For continuous variables the coefficient represents the change in annual income associated with the slope of that variable: therefore, for annual hours worked the coefficient represents the incremental annual income for another hour worked in the year; for proportion of Medicaid patients, the coefficient represents the incremental annual income associated with increasing the percentage of the practice population that is on Medicaid by 1%. In addition, we calculated standardized partial regression coefficients to help readers evaluate the relative importance of each of the variables in accounting for variance in income. For all analyses we used SPSS (version 11.5.1, Base and Advanced Models add-on module using the general linear models procedure) and the survey weights described above.
Results
Among white psychiatrists, after the analyses adjusted only for inflation, men had mean net annual incomes of $172,577 ( Table 1 ). Compared with men, women had mean annual inflation-adjusted incomes that were $45,158 (26%) lower (p<.001). Women reported working 13% fewer annual hours than their male counterparts (p<.001).
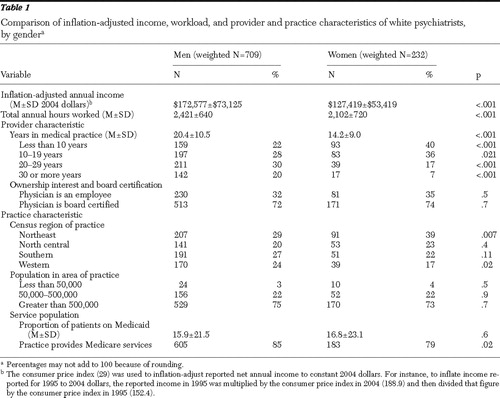 |
Women had practiced medicine for fewer years than men (p<.001): very few women who responded to the survey had practiced for more than 30 years (p<.001). Women were slightly more likely to be employees, as opposed to having an ownership interest in the practice, and to be board certified, although these findings were not statistically significant. Women were more likely to live in the Northeastern U.S. census region (p=.007) and less likely to live in the Western U.S. census region (p=.02). Practice settings were similarly distributed across population densities. The proportion of patients on Medicaid was small for both groups, and a large majority of both groups provided Medicare services.
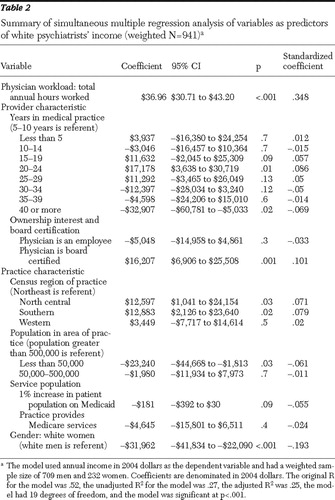
The regression model accounted for 25% of the variance in annual incomes and had strong face validity ( Table 2 ). More annual hours worked was associated with higher incomes. The anticipated inverted-U curve for lifetime earnings was reflected in the model, with incomes peaking after 20 to 25 years of practice. Being employed as opposed to having an ownership interest in the practice, working in less populated settings, and populating one's practice with a higher proportion of Medicaid patients were associated with a lower income. Board certification was associated with a higher income. After adjustment for these variables, the mean annual income of women was $140,651, or $31,962 (19%) lower than that for men (95% confidence interval=$41,834-$22,090 lower, p< .001). Therefore, the adjustment for differences in workload, provider characteristics, and practice characteristics partially mitigated the initial differences in inflation-adjusted annual incomes that were seen between white male psychiatrists and white female psychiatrists.
 |
Discussion
This study examined provider and practice characteristics that were likely to be associated with psychiatrists' annual incomes, revealed differences attributable to provider gender in those characteristics, adjusted net annual incomes for observed differences, and found that gender was independently associated with lower net annual incomes among office-based psychiatrists.
This analysis uncovered a strong association between higher annual incomes and workload. This finding is intuitive: physician reimbursement is largely based on the volume of patients seen, and psychiatrists tend to bill by the clock. In addition, a modest association between being employed, versus having an ownership interest, and having a lower mean annual income was found. This finding also has strong face validity: employed physicians might not be as motivated to see additional patients as those with an ownership interest in the practice. The hypothesis that providing services to a large proportion of patients who are enrolled in Medicaid might adversely influence physician income ( 28 ) was borne out fairly well in the regression analysis. Undoubtedly, the association between lower annual incomes and populating one's practice with Medicaid patients reflects the low reimbursement rates provided in general by Medicaid-funded health care services.
The association between higher annual incomes and board certification among psychiatrists replicated findings drawn from all physicians in the early 1980s ( 11 ). This association might be explained in part by a propensity for provider organizations to require board certification for employment, by requirements by third-party payers that providers be board certified, or by market forces that use board certification as a marker for quality that is indirectly reimbursed. In our analysis female psychiatrists were slightly more likely than male psychiatrists to be board certified, dispelling previous hypotheses that lower rates of board certification may explain female psychiatrists' lower incomes ( 10 ).
After correcting for differences in provider and practice characteristics, it was disconcerting to find that being a woman was associated with having an annual income that is so heavily discounted compared with that of men. That the anticipated 19% reduction in annual income found for white women was even greater than the 13% reduction found previously ( 10 ) is discouraging: even with greater workforce representation and higher board certification rates, female psychiatrists appear to be losing ground.
This analysis has several limitations. First, the study was limited by the methods AMA used in conducting its established annual survey of physicians, which resulted in a declining survey response rate and demonstrated substantial year-to-year variation in number of respondents during the period examined. However, the ability to combine ten years of data strengthened the study and offered a much more robust data set than would have been the case had fewer years of data been available.
Second, although we used the most recent data available, the data that we analyzed are becoming dated. It is possible that more recent data, should they become available, would show different results.
Third, although incomes were adjusted to constant dollars and were adjusted for practice setting, the analysis was not able to adjust for differences in purchasing-power parity across those settings—differences that have been shown to mitigate constant-dollar income differences among rural and urban physician practices ( 27 ).
Fourth, because of low numbers of black respondents to the surveys, we were unable to examine the influence of race on psychiatrists' incomes. Our findings therefore apply only to white psychiatrists who graduated from U.S. medical schools.
Fifth, the study was inherently limited by available data. Although it would have been interesting to explore alternative explanations for the income disparities that were found, such as the proportion of charity care provided within male and female psychiatrists' practices, respondents' educational debt burden, or even clinicians' levels of satisfaction with their practices, the data that might answer these questions were not available. The regression model accounted for only 25% in the variance of physician incomes; clearly, additional factors that were not incorporated into the analysis are likely to influence expected physician incomes and might mitigate the differences found here.
Finally, our findings are of an associative, not causative, nature. Additional study is required to determine causal pathways that might be associated with the lower incomes that female psychiatrists experienced. A variety of potential explanations for our findings may exist—for instance, women may have poorer negotiation skills than their male counterparts, different practice arrangements, different subspecialty practice types, and different academic ranks. However, differences in these factors may themselves be indicators of discrimination; therefore, future efforts will need to discern gender differences not only in outcome measures—that is, adjusted annual incomes—but also in process measures. Further, an understanding of female physicians' perception of any differences—particularly whether these differences are desired—will be important to delineate in future work.
Despite these limitations the results of this study suggest that female gender is independently associated with lower annual incomes among psychiatrists. These findings have implications for researchers and female psychiatrists. First, researchers should explore alternative explanations for our findings across a broad array of medical specialties. Second, female psychiatrists who are seeking employment may want to examine the workload and incomes of their male counterparts or obtain career mentoring, possibly through psychiatric professional organizations, when negotiating their salaries.
Although salary differences between men and women may be common in the United States ( 1 ), it seems untoward that a profession that embraces equity as a cornerstone of medical practice quality ( 30 ) should be tolerant of gender-based inequity in pay. Compared with their male counterparts, female psychiatrists have achieved the same level of education, made the same time commitment to training, and experienced the same direct and opportunity costs required of such commitment ( 24 ). Additional efforts to elucidate the underlying causes of any salary differences and to suggest remedies are warranted.
Conclusions
We found differences in the workload, practice characteristics, and provider characteristics when comparing male and female psychiatrists. After correcting for those differences, we found that female gender is independently associated with lower annual incomes among psychiatrists. Additional research that incorporates other variables that may be associated with psychiatrists' incomes should be performed.
Acknowledgments and disclosures
This work was supported in part by a Department of Veterans Affairs (VA) Health Services Research and Development Grant (REA 03-098). Dr. Wallace is a recipient of a VA Health Services Research and Development Advanced Career Development Award. The views expressed in this article do not necessarily represent the views of the Department of Veterans Affairs or of the United States government.
The authors report no competing interests.
1. Mishel L, Bernstein J, Schmitt J: The State of Working America, 2000–2001: An Economic Policy Institute Book. Ithaca, New York, ILR Press, 2001Google Scholar
2. AAMC Data Book: Statistical Information Related to Medical Schools and Teaching Hospitals. Washington, DC, Association of American Medical Colleges, 2000Google Scholar
3. Pasko T, Seidman B, Birkhead S: Physician Characteristics and Distribution in the US, 2000–2001 ed. Chicago, American Medical Association, Division of Survey and Data Resources, 2000Google Scholar
4. Langwell KM: Differences by sex in economic returns associated with physician specialization. Journal of Health Politics, Policy and Law 6:752–761, 1982Google Scholar
5. Ohsfeldt RL, Culler SD: Differences in income between male and female physicians. Journal of Health Economics 5:335–346, 1986Google Scholar
6. Carr P, Friedman R, Moskowitz M, et al: Research, academic rank, and compensation of women and men faculty in academic general internal medicine. Journal of General Internal Medicine 7:418–423, 1992Google Scholar
7. Baker L: Differences in earnings between male and female physicians. New England Journal of Medicine 334:960–964, 1996Google Scholar
8. Wallace AE, Weeks WB: Differences in income between male and female primary care physicians. Journal of the American Medical Women's Association 57:180–184, 2002Google Scholar
9. Ness R, Ukoli F, Hunt S, et al: Salary equity among male and female internists in Pennsylvania. Annals of Internal Medicine 133:104–110, 2000Google Scholar
10. Dial TH, Grimes PE, Leibenluft E, et al: Sex differences in psychiatrists' practice patterns and incomes. American Journal of Psychiatry 151:96–101, 1994Google Scholar
11. Becker ER, Culler S, Ohsfeldt R: Impact of board certification on physician practice characteristics. Journal of Medical Education 60:9–15, 1985Google Scholar
12. Zarin DA, Pincus HA, Peterson BD, et al: Characterizing psychiatry with findings from the 1996 National Survey of Psychiatric Practice. American Journal of Psychiatry 155:397–404, 1998Google Scholar
13. Jain S, Ballamudi B: Women in US Psychiatric training. Academic Psychiatry 28:299–304, 2004Google Scholar
14. Gonzalez M (ed): Physician Marketplace Statistics, 1992. Chicago, American Medical Association, Center for Health Policy Research, 1993Google Scholar
15. Gonzalez M (ed): Physician Marketplace Statistics, 1993. Chicago, American Medical Association, Center for Health Policy Research, 1993Google Scholar
16. Gonzalez M (ed): Physician Marketplace Statistics, 1994. Chicago, American Medical Association, Center for Health Policy Research, 1994Google Scholar
17. Gonzalez M (ed): Physician Marketplace Statistics, 1995. Chicago, American Medical Association, Center for Health Policy Research, 1996Google Scholar
18. Gonzalez M (ed): Physician Marketplace Statistics, 1996. Chicago, American Medical Association, Center for Health Policy Research, 1997Google Scholar
19. Gonzalez M (ed): Physician Marketplace Statistics, 1997/98. Chicago, American Medical Association, Center for Health Policy Research, 1998Google Scholar
20. Zhang P, Thran S: Physician Socioeconomic Statistics, 1999–2000. Chicago, American Medical Association, Center for Health Policy Research, 1999Google Scholar
21. Wassenaar J, Thran S: Physician Socioeconomic Statistics, 2000–2002. Chicago, American Medical Association, Center for Health Policy Research, 2001Google Scholar
22. Weeks WB, Wallace AE: Time and money: a retrospective evaluation of the inputs, outputs, efficiency, and incomes of physicians. Archives of Internal Medicine 163:944–948, 2003Google Scholar
23. Polackek SW, Siebert WS: The Economics of Earnings. Cambridge, United Kingdom, Cambridge University Press, 1993Google Scholar
24. Weeks WB, Wallace AE, Wallace MM, et al: A comparison of educational costs and incomes of physicians and other professionals. New England Journal of Medicine 330:1280–1286, 1994Google Scholar
25. Weeks WB, Wallace AE: The more things change: revisiting a comparison of educational costs and incomes of physicians and other professionals. Academic Medicine 77:312–319, 2002Google Scholar
26. Weil TP: Attracting qualified physicians to underserved areas: part 2. pay physicians more to practice in underserved areas. Physician Executive 25:53–63, 1999Google Scholar
27. Reschovsky JD, Staiti AB: Physician Incomes in Rural and Urban America. Issue Brief 92. Washington, DC, Center for Studying Health System Change, 2005Google Scholar
28. Moy E, Bartman BA: Physician race and care of minority and medically indigent patients. JAMA 273:1515–1520, 1995Google Scholar
29. Consumer Price Indexes. US Department of Labor, Bureau of Labor Statistics, 2006. Available at www.bls.gov/cpiGoogle Scholar
30. Berwick DM: A user's manual for the IOM's "Quality Chasm" report. Health Affairs 21(3):80–90, 2002Google Scholar