Inequity in Mental Health Care Under Canadian Universal Health Coverage
Abstract
OBJECTIVE: Previous research has produced conflicting evidence about socioeconomic disparities in mental health care under universal health coverage in Canada. This study sought to determine equity in the delivery of ambulatory services from psychiatrists and family physicians for mental health problems in this setting. METHODS: Outpatient billing claims and neighborhood socioeconomic status were examined with cross-sectional analysis. The study area consisted of the central southern portion of the city of Toronto, Ontario, including the city's downtown core. This urban setting is an economically and culturally diverse area. A total of 1,221 homogeneous enumeration areas (local neighborhoods) were surveyed, and data were examined for the 746,141 residents of these areas who had had a health visit in 2000. Rates of mental health visits to family physicians and psychiatrists were compared across socioeconomic quintiles. Socioeconomic status was determined according to educational attainment in the enumeration area. RESULTS: Claimants from neighborhoods with the highest socioeconomic status were 1.6 times as likely as those from neighborhoods with the lowest socioeconomic status to use psychiatric care. Among persons who received care from a psychiatrist, claimants from neighborhoods with the highest socioeconomic status had significantly more psychiatric claims than those from neighborhoods with the lowest socioeconomic status. No significant gradients were found for either sex for any use of mental health care provided by family physicians. Among females, service users from the highest socioeconomic areas had more mental health visits to family physicians than those from the lowest socioeconomic areas. CONCLUSIONS: Marked socioeconomic disparities were found in the use of care from a psychiatrist. Unlimited coverage of physician-provided mental health care is insufficient to fairly distribute services to those most in need.
Universal health care insurance was established in Canada to ensure equitable access to health care for all Canadians. In Ontario all legal residents are eligible for the provincial health plan, which fully covers medically necessary health services for both physical and mental problems without copayments and deductibles. In many respects this system is effective. Groups with lower socioeconomic status, which are known to have higher levels of morbidity, also tend to have higher rates of health care use (1,2). However, several Canadian studies have shown socioeconomic disparities in rates of use for a variety of health services despite universal coverage (2,3,4,5).
In the case of mental health care, groups with lower socioeconomic status have greater mental morbidity and therefore greater need for mental health care (6,7,8). Despite the increased need for services in lower socioeconomic status groups, in many settings it is the members of higher socioeconomic groups who receive more services. This disparity has been demonstrated for mental health specialty services in several U.S. health settings (9,10,11,12,13) and in a variety of other health systems (8,14,15,16).
In Canada, the situation is less clear. Under universal coverage of fee-for-service health care in Canada, four studies have reached different conclusions about socioeconomic disparities in mental health service use. Both Lin and colleagues (17) and Alegria and colleagues (8) used community survey data to demonstrate that rates of outpatient service use by financially disadvantaged groups were not significantly lower than those of groups that were not financially disadvantaged. Using the same data, Katz and colleagues (18) demonstrated that lower education levels were associated with lower rates of use of ambulatory mental health services. However, like Alegria and Lin, Katz (18) found no significant association between income level and level of service use. Finally, Tataryn and colleagues (19) found evidence of an association between income level and service use. He used administrative data to show that in urban areas of the province of Manitoba, ambulatory psychiatric care was provided more often to residents of wealthier neighborhoods.
The Canadian survey and administrative data used in the previously described papers on mental health service use are more than 15 years old. In the 1990s, significant efforts were made to destigmatize mental illness through public education campaigns. These efforts may have altered patterns of mental health service use over the past decade (12). We used administrative data from 2000 to test the null hypothesis that individuals from neighborhoods with higher socioeconomic status have no greater use of mental health services than those from neighborhoods with lower socioeconomic status under universal coverage of fee-for-service health care.
Methods
Setting
The study area consisted of the central southern portion of the city of Toronto, Ontario, including the city's downtown core. This urban setting is an economically and culturally diverse area that in 1996 contained 779,844 people and was spread across 1,257 census enumeration areas. Enumeration areas are the smallest units of Canadian census geography for which socioeconomic data are available. The study area is a heterogeneous region that includes some of the wealthiest and poorest neighborhoods in Canada, making it an ideal setting for comparing health status and health care use patterns. It is well served by public transit and has high provider-to-patient ratios for every specialty. This study was approved by the research ethics board of St. Michael's Hospital and the University of Toronto.
Measures of mental health service provision
We obtained health care utilization data through a research agreement with Ontario's Ministry of Health and Long-Term Care. Reimbursement, diagnostic, and demographic information were obtained from the Physician Claims Database and from the Ontario Registered Persons Database. These databases contain comprehensive individual-level data representing expenditures paid to fee-for-service physicians from the Ontario Health Insurance Plan. Only 5 percent of physician services in the province are not captured in the claims database (20). Examples of services missed include those provided by salaried physicians and by physicians who use alternative payment plans.
To be reimbursed for a patient visit, physicians are required to submit a claim that includes both an alphanumeric service code describing the specific service that has been provided (for example, general assessment or psychotherapy) and a diagnostic code. The diagnostic codes are three-digit truncated International Classification of Diseases codes; the physician provides the code that indicates the primary diagnostic reason for the visit. For our analyses, we defined mental health claims by physicians using a combination of service and diagnostic codes. We included claims made by family physicians (including general practitioners) and psychiatrists in 2000. These two physician groups accounted for 97.5 percent of all claims with mental health diagnoses. For psychiatrists, we considered all ambulatory claims to be mental health claims. For family physicians, we used all ambulatory claims that were associated with a mental health diagnostic code. This use of administrative codes is 81 percent sensitive and 97 percent specific for identifying mental health visits to family physicians (21). To investigate patterns of mental health service use by diagnosis, we grouped specific codes into the following diagnostic groups: psychotic disorders, nonpsychotic disorders, addictions, and social problems.
Measures of socioeconomic status
We assigned claimants' postal codes to enumeration areas by using Statistics Canada's Postal Code Conversion File Plus (22). We used the 1996 Canada census variable that describes the percentage of individuals older than 15 years with a high school diploma for each enumeration area. Education information is collected on the long census questionnaire that is received by one in five households in Canada. We chose this socioeconomic indicator because education has demonstrated usefulness as a single indicator of socioeconomic status at the neighborhood level, information about education tends to be more accurate than income information, and education was the socioeconomic variable with the most complete data in our database (23). Because Canadians typically graduate from high school between ages 17 and 18, the education variable constructed by Statistics Canada will overestimate the proportion of adults who did not achieve a high school diploma by including current students who are 16 and over. The 16 to 18 year age group comprises approximately 4 percent of the Canadian population (24).
For our regression analyses we used the percentage of individuals with a high school diploma as a continuous independent variable (0 to 100). To calculate rate ratios between neighborhoods with high and low levels of education, we sorted the enumeration areas into education quintiles by dividing them into five ordered groups with roughly the same number of claimants in each group. Education quintiles were labeled as Q1 through Q5, with Q1 being the area with the lowest education. In a separate study, we compared the use of claimants' postal codes from the Registered Persons Database for assigning socioeconomic status to the use of postal codes from hospital discharge summaries and found that significant misclassification of socioeconomic status by the Registered Persons Database method was relatively uncommon and did not result in marked changes in rate ratios for health service use (25).
Analysis
We calculated the number of claimants with any mental health claim per 1,000 claimants (any use) and the number of claims per 1,000 mental health service users (number of claims) by education quintile and source of care (family physicians or psychiatrists). Individuals with claims from both family physicians and psychiatrists were counted in the rates of both groups. We also calculated rates of frequent use (defined as 20 or more claims per year) by socioeconomic quintiles and rates of claims by specific diagnostic groupings.
We did not limit our analyses to claimants in specific age or sex groups. Rather, we stratified all the rates by sex and adjusted the rates by five-year age groups by using the indirect method of standardization (26). A ratio of rates for two groups that differ in their exposure to a possible risk factor (for example, education level) is often called a rate ratio (26). We calculated rate ratios comparing the mean rates of the highest and lowest education quintiles (Q5:Q1 rate ratio). For each rate ratio, we derived 95 percent confidence intervals by using bootstrapping techniques (27). With education level of the enumeration area as a continuous variable, we used ordinary least squares regression to test the overall significance of the association between education level and mental health service use. As a validity check, we reanalyzed the data by using mean household income to define the socioeconomic status of our enumeration areas rather than education levels. All analyses were done with version 8 of the SAS system for UNIX (28).
Results
There were 1,257 enumeration areas within the geographic boundaries of our study area. We excluded 14 enumeration areas with missing education information and 22 enumeration areas with billing information for fewer than 50 residents, leaving 1,221 enumeration areas for analysis. Each contained a mean±SD of 639±263 residents (range of 97 to 1,549 residents). Table 1 shows the demographic characteristics of the study area by quintile and comparison characteristics for the province of Ontario.
The total number of ambulatory claims (including both mental health and non-mental health claims) was 5,832,601, and the total number of individuals who had an ambulatory claim in 2000 was 746,141. The average number of ambulatory health claims per person was 7.8. On average, females had more claims per person (mean of 8.4±9.7 claims) than males (mean of 7.1±9.0 claims). Individuals from the neighborhoods with the highest socioeconomic status had a similar number of claims per person as individuals from the neighborhoods with the lowest socioeconomic status.
In our study area, 36,428 individuals saw a psychiatrist and 135,726 individuals saw a family physician for mental health services. There were 433,882 ambulatory psychiatric claims (mean of 12.0±19.3 per mental health service user who saw a psychiatrist), and 464,436 mental health claims were submitted through a family physician (mean of 3.4±6.6 per mental health service user who saw a family physician). Of the psychiatric claims, 74,769 (17.2 percent) were for psychotic disorders, 352,024 (81.1 percent) were for nonpsychotic disorders, 4,818 (1.1 percent) were for addictions, and 2,271 (.5 percent) were for social problems. Of the mental health claims submitted through a family physician, 21,492 (4.6 percent) were for psychotic disorders, 353,039 (76.0 percent) were for nonpsychotic disorders, 66,190 (14.3 percent) were for addictions, and 23,715 (5.1 percent) were for social problems.
Use of specialty mental health services
Significant socioeconomic differences were seen for the number of individuals who had any use of psychiatric care. Male and female claimants from the neighborhoods with the highest socioeconomic status were more likely than those from the neighborhoods with the lowest socioeconomic status to see a psychiatrist (rate ratio [RR] for males=1.6, 95 percent confidence interval [CI]=1.4 to 1.7; RR for females=1.6, CI=1.5 to 1.7). This result corresponds to an absolute difference of 21 more males per 1,000 (CI=17 to 25) using psychiatric care and 23 more females per 1,000 (CI=20 to 27) using psychiatric care in the highest education quintile. The results of the regression analyses are summarized in Table 2. Linear regression confirmed the significance of a gradient across neighborhood education levels for male claimants (R2=.11, F=220.6, df=1, 1,220, p<.001) and female claimants (R2=.15, F=150.0, df=1, 1,220, p<.001).
Marked socioeconomic differences were seen in the number of psychiatric claims by both males and females who saw a psychiatrist. After the analyses adjusted for age, psychiatric service users from neighborhoods with the highest socioeconomic status had almost twice as many psychiatric claims as those from neighborhoods with the lowest socioeconomic status (male RR=1.8, CI=1.7 to 2.0; female RR=1.9, CI=1.7 to 2.1). These ratios correspond to an absolute difference of six more visits per male (CI=5 to 7) and seven more visits per female (CI=6 to 8) in the highest education quintile. Linear regression analysis confirmed the significance of the socioeconomic gradient across education levels for both the male claimants (R2=.13, F=190.0, df=1, 1,220, p<.001) and the female claimants (R2=.16, F=234.7, df=1, 1,220, p<.001).
Use of family physicians' mental health services
We did not see marked socioeconomic gradients in mental health service provision by family physicians. No significant rate ratios were found for the highest and lowest education groups for the number of individuals who had any use mental health services provided by family physicians. Linear regression showed a slight negative gradient across education levels only for female claimants for any mental health care provided by family physicians (R2=.04, F=12.4, df =1, 1,220, 1, p<.001).
A significant rate ratio was found only for females for the number of mental health claims submitted by family physicians among users of mental health care provided by family physicians (RR=1.2, CI=1.1 to 1.2). This ratio corresponds to an absolute difference of five more visits per female mental health care user in the highest education quintile (CI=4 to 7). Among users of care, linear regression demonstrated a slight but significant positive socioeconomic gradient across quintiles only for female users of care (R2=.04; F=52.6, df=1, 1,220, p<.001).
Frequency of visits
Among individuals with any mental health service use, those in the highest socioeconomic quintile had more claims per person than those in the lowest socioeconomic quintile: for psychiatrists, Q5=15.6 claims per person (CI=15.1 to 16.1) and Q1=8.2 claims per person (CI=7.9 to 8.6); for family physicians, Q5=3.4 claims per person (CI=3.4 to 3.7) and Q1=3.2 claims per person (CI=3.1 to 3.2). Table 3 shows that individuals from neighborhoods with higher socioeconomic status were more likely to be frequent users of psychiatric care. Among users of care provided by a psychiatrist, the mean percentage of individuals in the lowest socioeconomic neighborhoods who had 20 or more psychiatric claims was 11.6 percent, whereas the mean percentage of those in the neighborhoods with the highest socioeconomic status was 24.1 percent (t=16.1, df=465, p<.001). A much smaller difference was seen for individuals who received mental health care from family physicians—on average 2.6 percent of residents in the neighborhoods with the lowest socioeconomic status and 3.3 percent of residents in the neighborhoods with the highest socioeconomic status had 20 or more claims (t=4.2, df=472, p<.001).
Diagnostic groupings
Tables 4 and 5 present the Q5:Q1 rate ratios and absolute rate differences by diagnostic groups. For psychiatrists, strong positive socioeconomic gradients in care were seen for nonpsychotic disorders, such as anxiety and depression, and for social problems but not for psychotic disorders or addictions. For family physicians, the analyses suggest negative socioeconomic gradients for psychotic disorders and addictions and mostly positive socioeconomic gradients for nonpsychotic disorders and social problems.
Income analysis
The Q5:Q1 rate ratios were somewhat lower when socioeconomic status was defined by income rather than by education. However, our conclusions remained the same with this reanalysis. [A table presenting these results is available in the online version of this article at ps.psychiatry online.org.]
Discussion
This study demonstrated marked inequity in the provision of services by psychiatrists under universal health care coverage. If the level of provision of mental health services were an appropriate reflection of service need, we would see a strong inverse association between socioeconomic status and utilization rates of mental health services (6,7). The expected inverse gradient is missing for family physicians and is in fact in the opposite direction for psychiatrists. Not only did more individuals from higher socioeconomic status neighborhoods use psychiatric care at least once, they also had higher numbers of claims than individuals from lower socioeconomic status neighborhoods. Claims for nonpsychotic disorders and social problems, which included depression and anxiety disorders, most closely followed this pattern. On the other hand, claims for psychotic disorders and addictions showed an inverse gradient for family doctors and no significant gradient for psychiatrists. This finding suggests that universal health care coverage in our setting is supporting regular psychiatric treatment for individuals with high socioeconomic status and comparatively milder psychiatric disorders to a larger degree than it supports care for disadvantaged groups or those with severe and persistent mental illness.
Several factors may contribute to this pattern. First, initial appointments with psychiatrists usually require a referral from a family physician. Although the evidence for the following theory is conflicting, patients from lower socioeconomic status neighborhoods may be less likely to request a referral to a psychiatrist because of differences in attitudes or perceived stigma associated with seeing a mental health specialist (29,30,31). Second, family physicians may believe that patients with a lower socioeconomic status will not benefit as much from psychiatric referral, although at least some evidence suggests that this belief is unfounded (32). Third, patient factors that are correlated with socioeconomic status, such as ethnicity, may affect family physicians' propensity to refer to or patients' willingness to accept psychiatric care (14). In our setting, recent immigrants in a low socioeconomic status group without a good knowledge of English may not be referred because of communication barriers with their family physicians or because no psychiatrist is available who speaks their language. Finally, it might also be the case that family physicians have difficulty finding appropriate psychiatric care for certain marginalized groups (33).
From our analysis, we cannot ascertain with certainty whether the difference in socioeconomic status in the frequency of care provided by a psychiatrist is patient driven—with individuals with higher socioeconomic status more likely than those with lower socioeconomic status to attend follow-up appointments with psychiatrists (34,35)—or provider-driven—with residents with higher socioeconomic status being considered more suitable for treatments that require more frequent visits. Nor can we ascertain with certainty whether this difference represents inadequate service delivery to groups with high morbidity and low socioeconomic status or inappropriate service use by groups with low morbidity, high socioeconomic status.
In 1997, Katz and colleagues (36) reported "little evidence [in Ontario] of excessive use of services by persons with low mental morbidity and impairment, at least relative to the United States." However, the socioeconomic gradients seen in our study were most marked among individuals who had 20 or more psychiatric visits. No published literature convincingly argues for the appropriateness of frequent visits only in the higher socioeconomic strata. Moreover, except for personality disorders (37), the evidence supporting the usefulness of frequent, long-term psychiatric treatment of any type is not strong. For example, long-term psychodynamic psychotherapy is ineffective for schizophrenia (38), and clinical practice guidelines agree about the weak evidence base for this therapy for treating depression (39,40). Studies of manualized therapies such as cognitive-behavioral therapy most often use interventions comprising fewer than 20 visits. For studies that demonstrate improvement with long-term psychiatric treatment, the frequency of the interventions did not exceed 20 visits per year (41).
Our findings contrast with Ontario surveys that did not show marked socioeconomic status gradients in mental heath care (8,17,18). One study measured any use of mental health care but not frequency of use (8), and two measured frequency of use and relied on patient self-report for this measurement (17,18). Self-report has been shown to overestimate the frequency of mental health visits among individuals with high levels of distress. This bias could have obscured differences in socioeconomic status in analyses that used survey data (42,43). Because those studies were provincewide, it is also possible that the socioeconomic status gradients we found are limited to urban settings.
Unlike the previous studies that used survey data, socioeconomic status in this study was attributed by area rather than at the individual level. The areas used, however, were small and homogeneous, making it unlikely that a few individuals with low socioeconomic status who were residing in areas of high socioeconomic status were responsible for the patterns that we found. It is also the case that socioeconomic status gradients in service use at the neighborhood level have importance, above and beyond individual-level gradients, for understanding and planning health service delivery and for health policy (22).
Using administrative rather than survey data, we may have missed some mental health care by lower socioeconomic status groups. The most marginalized groups may be involved in community programs that provide counseling from social workers, nurses, or psychologists or use complementary or alternative types of care. However, in our setting most community nonphysician mental health workers charge patients directly for their services or are paid privately through employees' health insurance plans, and consequently individuals who use these services tend to be of above average income and education level (44).
Our denominators included only individuals who had recent contact with the fee-for-service health system. Individuals who have not used any care in our study year were not included in our rates. If individuals who are not actively using health care are more likely to be from neighborhoods with higher socioeconomic status, then rates in that group could be falsely elevated. Because of this uncertainty, we need to be cautious in our interpretation of our conclusions. The gradients that we have found may be less steep when measured at a population level.
A final caution relates to the accuracy of our diagnostic groupings. Although we have reported the sensitivity and specificity of our primary measure, which uses a broad definition of mental health visit, we cannot assume similar accuracy when we use groups of codes to identify visits related to specific diagnostic groups. Consequently, the analyses that we have reported on the basis of diagnostic groupings should be viewed as exploratory.
Conclusions
In our urban Canadian setting there are no premiums charged to individuals who use mental health services. However, despite the unlimited coverage of fee-for-service mental health care we found marked socioeconomic disparities in service use. Clearly, eliminating financial barriers through universal health care coverage is insufficient to address the distributional equity problem that exists for mental health care. In settings that are attempting to reduce socioeconomic disparities in mental health care, strategies such as actively targeting low socioeconomic status groups and limiting the frequency of visits for some conditions might also be needed to avoid serious inequity.
Acknowledgments
This research was funded by the Centre for Research in Inner City Health at St. Michael's Hospital. This centre is generously supported by a grant from the Ontario Ministry of Health and Long-Term Care. Dr. Steele and Dr. Glazier are supported as research scholars in the department of family and community medicine at the University of Toronto. Dr. Steele is also supported as a career scientist by the Ontario Ministry of Health and Long-Term Care.
Dr. Steele and Dr. Lin are affiliated with the health systems research and consulting unit at the Centre for Addiction and Mental Health, 33 Russell Street, 3rd Floor Tower, Toronto, Ontario, M5S 2S1 Canada (e-mail, [email protected]). Dr. Glazier is with the Centre for Research in Inner City Health and the department of family community medicine at St. Michael's Hospital in Toronto, with which Dr. Steele is also affiliated.
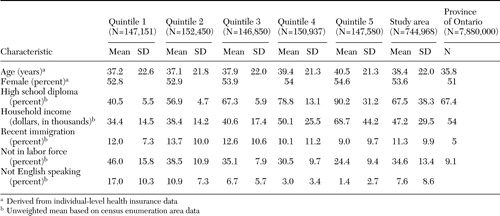 |
Table 1. Demographic characteristics of South Central Toronto, by education quintile
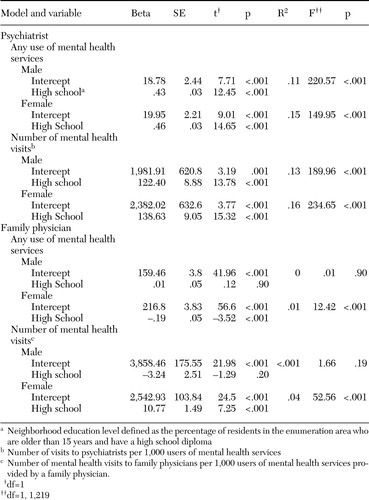 |
Table 2. Linear regression models for association between neighborhood education level and mental health service use in South Central Torontoa
a Neighborhood education level defined as the percentage of residents in the enumeration area who are older than 15 years and have a high school diploma
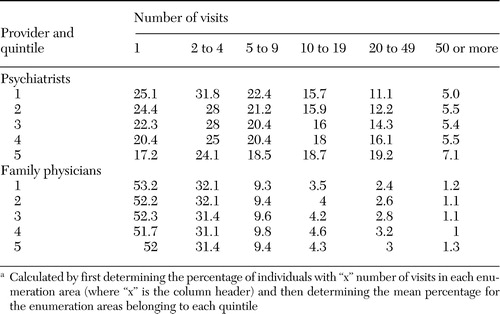 |
Table 3. Number of mental health visits to psychiatrists and family physicians in South Central Toronto, by socioeconomic quintilea
a Calculated by first determining the percentage of individuals with "x" number of visits in each enumeration area (where "x" is the column header) and then determining the mean percentage for the enumeration areas belonging to each quintile
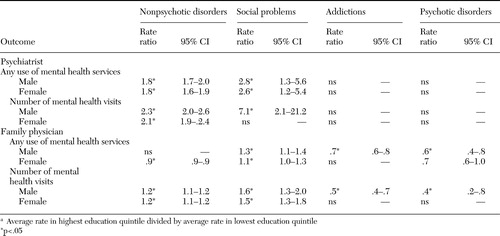 |
Table 4. Rate ratiosa of use of mental health services between higher and lower socioeconomic neighborhoods in South Central Toronto, by diagnostic group
a Average rate in highest education quintile divided by average rate in lowest education quintile
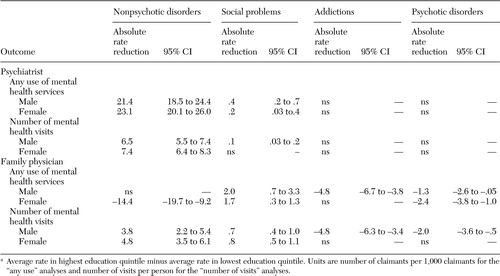 |
Table 5. Absolute rate reductions of use of mental health services between higher and lower socioeconomic neighborhoods in South—Central Toronto, by diagnostic groupa
a Average rate in highest education quintile minus average rate in lowest education quintile. Units are number of claimants per 1,000 claimants for the "any use" analyses and number of visits per person for the "number of visits" analyses.
1. Katz SJ, Hofer TP, Manning WG: Hospital utilization in Ontario and the United States: the impact of socioeconomic status and health status. Canadian Journal of Public Health 87:253–256,1996Medline, Google Scholar
2. Roos NP, Mustard CA: Variation in health and health care use by socioeconomic status in Winnipeg, Canada: does the system work well? Yes and no. Milbank Quarterly 75:89–111,1997Crossref, Medline, Google Scholar
3. Alter DA, Naylor CD, Austin P, et al: Effects of socioeconomic status on access to invasive cardiac procedures and on mortality after acute myocardial infarction. New England Journal of Medicine 341:1359–1367,1999Crossref, Medline, Google Scholar
4. Katz SJ, Hofer TP: Socioeconomic disparities in preventive care persist despite universal coverage: breast and cervical cancer screening in Ontario and the United States. JAMA 272:530–534,1994Crossref, Medline, Google Scholar
5. Dunlop S, Coyte PC, McIsaac W: Socio-economic status and the utilization of physicians' services: results from the Canadian National Population Health Survey. Social Science and Medicine 51:123–133,2000Crossref, Medline, Google Scholar
6. Regier DA, Farmer ME, Rae DS, et al: One-month prevalence of mental disorders in the United States and sociodemographic characteristics: the Epidemiologic Catchment Area study. Acta Psychiatry Scandinavica 88:35–47,1993Crossref, Medline, Google Scholar
7. Kessler RC, McGonagle KA, Zhao S, et al: Lifetime and 12-month prevalence of DSM-III-R psychiatric disorders in the United States: results from the National Comorbidity Survey. Archives of General Psychiatry 51:8–19,1994Crossref, Medline, Google Scholar
8. Alegria M, Bijl RV, Lin E, et al: Income differences in persons seeking outpatient treatment for mental disorders: a comparison of the United States with Ontario and the Netherlands. Archives of General Psychiatry 57:383–391,2000Crossref, Medline, Google Scholar
9. Wang PS, Berglund PA, Kessler RC: Recent care of common mental disorders in the United States: prevalence and conformance with evidence-based recommendations. Journal of General Internal Medicine 15:284–292,2000Crossref, Medline, Google Scholar
10. McAlpine DD, Mechanic D: Utilization of specialty mental health care among persons with severe mental illness: the roles of demographics, need, insurance, and risk. Health Services Research 35:277–292,2000Medline, Google Scholar
11. Narrow WE, Regier DA, Norquist DSR, et al: Mental health service use by Americans with severe mental illness. Social Psychiatry and Psychiatric Epidemiology 35:147–155,2000Crossref, Medline, Google Scholar
12. Olfson M, Marcus SC, Druss B, et al: National trends in the outpatient treatment of depression. JAMA 287:203–209,2002Crossref, Medline, Google Scholar
13. Howard KI, Cornille TA, Lyons JS, et al: Patterns of mental health service utilization. Archives of General Psychiatry 53:696–703,1996Crossref, Medline, Google Scholar
14. Commander MJ, Dharan SP, Odell SM, et al: Access to mental health care in an inner-city health district: II. Association with demographic factors. British Journal of Psychiatry 170:317–320,1997Crossref, Medline, Google Scholar
15. Sorgaard KW, Sandanger I, Sorensen T, et al: Mental disorders and referrals to mental health specialists by general practitioners. Social Psychiatry and Psychiatric Epidemiology 34:128–135,1999Crossref, Medline, Google Scholar
16. Feinson MC, Lerner Y, Levinson D, et al: Ambulatory mental health treatment under universal coverage: policy insights from Israel. Milbank Quarterly 75:235–259,1997Crossref, Medline, Google Scholar
17. Lin E, Goering P, Offord DR, et al: The use of mental health services in Ontario: epidemiologic findings. Canadian Journal of Psychiatry 41:572–577,1996Crossref, Medline, Google Scholar
18. Katz SJ, Kessler RC, Frank RG, et al: Mental health care use, morbidity, and socioeconomic status in the United States and Ontario. Inquiry 34:38–49,1997Medline, Google Scholar
19. Tataryn D, Mustard CA, Derksen S: The Utilization of Medical Services for Mental Health Disorders: Manitoba:1991–1992. Winnipeg, Manitoba Centre for Health Policy and Evaluation,1994Google Scholar
20. Lin E, Chan B, Goering P: Variations in mental health needs and fee-for-service reimbursement for physicians in Ontario. Psychiatric Services 49:1445–1450,1998Link, Google Scholar
21. Steele LS, Glazier R, Lin E, et al: Using administrative data to measure ambulatory mental health service provision in primary care. Medical Care 42:960–965,2004Crossref, Medline, Google Scholar
22. Postal Code Conversion File Plus (PCCF+). Ottawa, Statistics Canada, 2002Google Scholar
23. Krieger N, Williams DR, Moss NE: Measuring social class in US public health research. Annual Review of Public Health 18:341–378,1997Crossref, Medline, Google Scholar
24. CANSIM, table 051-0001. Population by age and sex. Statistics Canada. Last modified Feb 10, 2005. Available at www40.statcan.ca/l01/cst01/demo10a.htm?sdi=age. Accessed on Sept 12, 2005Google Scholar
25. Glazier RH, Creatore MI, Agha M, et al: Socioeconomic misclassification using ambulatory care postal codes in Ontario. Canadian Journal of Public Health 94:140–143,2003Crossref, Medline, Google Scholar
26. Kelsey JL, Whittemore AS, Evans AS, et al: Methods in Observational Epidemiology, 2nd ed. New York, Oxford University Press, 1996Google Scholar
27. Efron B, Tibshirani RJ: An Introduction to the Bootstrap. New York, Chapman and Hall, 1993Google Scholar
28. SAS software, Version 8 of the SAS system of Unix. Cary, NC, SAS Institute Inc, 1999Google Scholar
29. Lin E, Parikh SV: Sociodemographic, clinical, and attitudinal characteristics of the untreated depressed in Ontario. Journal of Affective Disorders 53:153–162,1999Crossref, Medline, Google Scholar
30. Bland RC, Newman SC, Orn H: Help seeking for psychiatric disorders. Canadian Journal of Psychiatry 42:935–942,1997Crossref, Medline, Google Scholar
31. Mojtabai R, Olfson M, Mechanic D: Perceived need and help-seeking in adults with mood, anxiety, or substance use disorders. Archives of General Psychiatry 59:77–84,2002Crossref, Medline, Google Scholar
32. Isohanni I, Nieminen P, Isohanni M: The relationship between patients' educational level and therapeutic process in an acute patients' therapeutic community. European Journal of Psychiatry 12:130–135,1997Crossref, Google Scholar
33. Craven MA, Cohen M, Campbell D, et al: Mental health practices of Ontario family physicians: a study using qualitative methodology. Toronto, Institute for Clinical Evaluative Sciences, 1996Google Scholar
34. Edlund MJ, Wang PS, Berglund PA, et al: Dropping out of mental health treatment: patterns and predictors among epidemiological survey respondents in the United States and Ontario. American Journal of Psychiatry 159:845–851,2002Link, Google Scholar
35. Rossi A, Amaddeo F, Bisoffi G, et al: Dropping out of care: inappropriate terminations of contact with community-based psychiatric services. British Journal of Psychiatry 181:331–338,2002Crossref, Medline, Google Scholar
36. Katz SJ, Kessler RC, Frank RG, et al: The use of outpatient mental health services in the United States and Ontario: the impact of mental morbidity and perceived need for care. American Journal of Public Health 87:1136–1143,1997Crossref, Medline, Google Scholar
37. Meares R, Stevenson J, Comerford A: Psychotherapy with borderline patients: I. a comparison between treated and untreated cohorts. Australia and New Zealand Journal of Psychiatry 33:467–472,1999Crossref, Medline, Google Scholar
38. Malmberg L, Fenton M: Individual Psychodynamic Psychotherapy and Psychoanalysis for Schizophrenia and Severe Mental Illness. Cochrane Library, Issue 4. Chicester, United Kingdom, Wiley, 2003Google Scholar
39. Segal ZV, Whitney DK, Lam RW: Clinical Practice Guidelines for the Treatment of Depressive Disorders: III. Psychotherapy. Canadian Journal of Psychiatry 46:29S-37S,2001Medline, Google Scholar
40. Practice Guideline for the Treatment of Patients With Major Depression, 2nd ed. American Psychiatric Association, 2000. Available at www.psych.org/psychpract/treatg/pg/depression2e.book.cfm. Accessed Jun 30, 2003Google Scholar
41. Rost K, Nutting P, Smith JL, et al: Managing depression as a chronic disease: a randomised trial of ongoing treatment in primary care. British Medical Journal 325:934,2002Crossref, Medline, Google Scholar
42. Rhodes AE, Funk K: Self-reported use of mental health services versus administrative records: care to recall. International Journal of Methods in Psychiatric Research 13:165–175,2004Crossref, Medline, Google Scholar
43. Rhodes AE, Lin E, Mustard CA: Self-reported use of mental health services versus administrative records: should we care? International Journal of Methods in Psychiatric Research 11:125–133,2002Google Scholar
44. Hunsley J, Lee CM, Aubrey T: Who uses psychological services in Canada? Canadian Psychology 40:232–240,1999Google Scholar


