Economic Grand Rounds: The Optimum Expenditure for State Hospitals and Its Relationship to the Suicide Rate
Our previous research has suggested that there is an optimum ratio of state-operated to community-operated psychiatric hospital beds (1). We arrived at this ratio by determining the demand for mental health services in Maine, which was based on the number of admissions to psychiatric inpatient facilities over a one-year period. We found that there was 28 percent more uncertainty (based on Boltzman's definition of entropy) among the patients than caregivers could negate through the application of their knowledge and skills.
We conducted a mathematical conversion from a formula expressing entropy to one expressing a power law (1). The final result was the optimum distribution of the number of community (private) inpatient beds and state (public) beds, which was expressed as a ratio of 57 percent to 43 percent. That is, because of greater inpatient expense and high risk, 43 percent of the beds, constituting only 8 percent of the admissions—because of the nonlinear nature of service demand—should be the state's responsibility.
An inadequate number of state hospital beds, which is a consequence of decreased funding, has forced community facilities to operate at nearly 100 percent bed occupancy and to admit patients whose history and severity of illness would normally result in admission to a state hospital. Thus the community hospitals often cannot admit new patients in a timely fashion, and persons with less severe mental illness, who would normally be admitted to a community hospital for a brief stay, may be inappropriately admitted to a state hospital. These situations degrade the quality of care systemwide, and the provision of poor-quality care is costly to the system in the long term (2).
The National Association of State Mental Health Program Directors (NASMHPD) Research Institute has published data from state mental health agencies on the distribution of state funds over the past 16 years (3). The variation in the proportion of funds allotted to state hospitals and to community-based services over the years was striking. No two states had similar patterns. Particularly notable, however, was that the average of all 50 states was close to the optimum ratio that we had previously calculated—57 percent to 43 percent. Although our ratio was for inpatient psychiatric beds, we believe that the number of beds, or the proportion of beds, is a reasonable surrogate for costs. States might be able to improve the quality of care and reduce the suicide rate if they bring their funding levels more into line with the ideal ratio. Suicide rate has been used as a measure of the quality of care: the lower the suicide rate, the better the care.
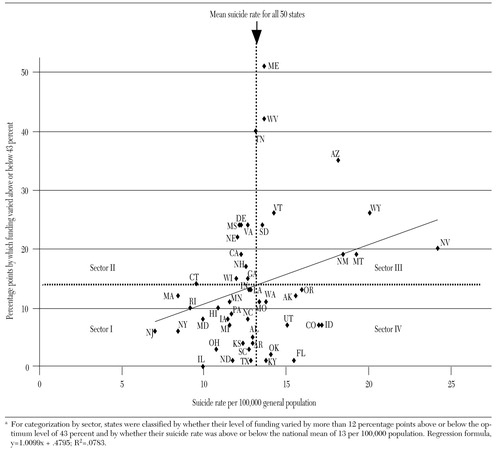
Figure 1 illustrates the relationship between suicide rate and the difference between the ideal proportion of 43 percent and the actual percentage of funds allocated to state hospitals by state mental health agencies in fiscal year 1997, the last year for which state agency data were available. For each state we calculated the funding level by subtracting 43 percent from the actual percentage of funds allocated to state hospitals. The percentages on the vertical axis represent the extent to which the allocation varied above or below the optimum level of 43 percent. The values on the horizontal axis represent the number of suicides per 100,000 population according to 1997 data for each state. Note that the regression line reveals a linear relationship between the suicide rate and the absolute difference between the actual and the ideal state hospital allocation.
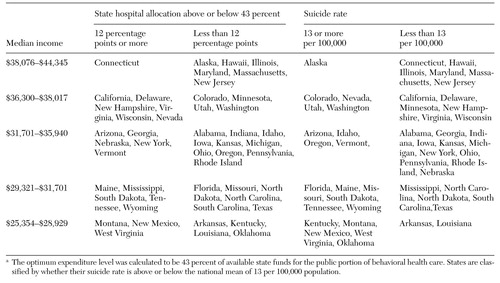
In Table 1 the 50 states are categorized by median per capita income, by the extent to which state hospital spending varied from the optimum, and by whether the suicide rate was above or below the national mean. In the states listed in column 1, spending varied more than 12 percentage points above or below the optimum level of 43 percent. In the states listed in column 2, spending was within 12 percentage points of the optimum.
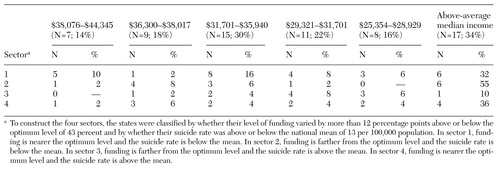
Figure 1 is divided into four sectors, separated vertically by a line representing the mean suicide rate for all 50 states and horizontally by a dotted line at the crossing of the linear regression line for all 50 states with the vertical line representing the mean suicide rate. Table 2 presents the number of states in each sector that fall into each median income category. The last column in Table 2 lists the percentage of states in each sector with an above-average median income.
In sector 3 are states in which the level of funding varied by more than 12 percentage points above or below the optimum level and in which the suicide rate was higher than the mean. In five of the sector 3 states, the allocation for state hospitals exceeded the optimum, and in five states it fell below the optimum. Therefore, one might conclude that a state's having too many or too few state hospital beds in relation to the theoretical ideal leads to a higher-than-average suicide rate. Sector 3 also has the lowest proportion of states with an above-average median income—only 10 percent of the states in this sector. Five states in sector 3—Arizona, New Mexico, Montana, Wyoming, and Nevada—had a suicide rate above 18 per 100,000 population.
In sector 4 are states with a range of expenditures for state hospitals, all within 12 percentage points above or below of the optimum level of 43 percent. The states in this sector also had an above-average suicide rate, although none above 17 per 100,000 population.
State hospital expenditures in the states in sector 2, which all had a below-average suicide rate, varied by more than 12 percentage points from the optimum. In seven states, funding exceeded the optimum, and in four states, funding was less than the optimum. This finding suggests that in terms of patient safety, spending more on state hospitals is preferable to spending less. Sector 2 has the highest percentage of wealthy states—six of the states (67 percent) had an above-average median income. Greater expenditures on state hospitals may be necessary to reduce the suicide rate, and states in which the median income is higher are more likely to have funds available.
In sector 1 are states in which the suicide rate was below the mean. In these 19 states, funding for state hospitals was within 12 percentage points of the optimum level. Nine states allocated more than the optimum, and eight states allocated less. In one state, Illinois, the funding level was at 43 percent (a value of zero on the vertical axis). The five states with the highest median income—Massachusetts, New Jersey, Illinois, Hawaii, and Maryland—are in this sector. In addition, sector 1 has the greatest proportion of states with an average median income—eight of the 21 states (38 percent).
Discussion
The results of this study show a direct relationship between the proportion of funds that a state allocates for state hospitals and the suicide rate. The suicide rate was lower in states in which the percentage of funds allocated to state hospitals and to community-based services were close to the optimum theoretical proportions. The finding that, on average, the 50 states are moving toward this optimum ratio of funding supports the notion that there might be "wisdom in the mean."
According to data from the NASMHPD Research Institute, the states that spent the greatest amount on mental health care in fiscal year 1997—that is, between $75 and $115 per capita—are Washington, Montana, Minnesota, Michigan, New York, Vermont, New Hampshire, Massachusetts, Connecticut, Maine, Rhode Island, and Alaska. According to our model, Minnesota, Michigan, New York, Massachusetts, Connecticut, Rhode Island, and New Hampshire appear to be obtaining full value for their state hospital appropriation. On the other hand, Montana, Vermont, Washington, and Alaska are not achieving as good a result as their level of state hospital funding would suggest, at least as measured by the suicide rates in those states. It may not be coincidental that these five states are located in the northern United States. The widely variable light-dark cycle in these states—the seasonal effect—may affect rates of depression and other mental illnesses (4). It may take even more funding or more effective treatments to negate such effects.
According to the NASMHPD data, the states spending the least for behavioral health care—less than $40 per capita—are Texas, New Mexico, Colorado, Idaho, Nebraska, Missouri, Kansas, Tennessee, Kentucky, Illinois, and West Virginia. Our model indicates that Texas, Nebraska, Kansas, and Illinois are obtaining good value for their relatively low level of mental health care funding because their suicide rates are low. Colorado, Idaho, Kentucky, and Missouri, where the suicide rates are higher than average even though the funding levels for state hospitals are not far out of line with the optimum, would probably benefit from increased funding. Tennessee, Maine, and West Virginia, where funding for state hospitals exceeds the optimum, might benefit from increased spending on community-based services. On the other hand, increased funding for state hospitals in New Mexico might allow hospital staff to better stabilize patients during an intensive, tertiary hospital stay.
It should be noted that these suggestions are based on 1997 data, which were the most current data available when we constructed our model. Conditions in some of the states mentioned are almost certainly different now. Nevertheless, we believe that the same methodology can be used with current data. We also emphasize that our study did not attempt to catalogue all the causes of suicide. Rather, we attempted to demonstrate that features of the mental health care delivery system may play a role in altering the suicide rate, whatever the causes of suicide.
The R2 value of the model is admittedly low at about 8 percent. (This statistic represents the percentage of the variation predicted by the regression line, a perfect match being unity.) However, in the absence of a clear strategy based on any scientific principle, the states have had little guidance in their management of funding. Therefore, we would expect considerable scatter in Figure 1. We would expect the R2 value to increase as states approach the ideal ratio for funding.
There appears to be a gradient in the suicide rate in the United States, with the rate increasing from the East to the West Coast (5). Genetics may partly explain this phenomenon: people who are likely to move toward the frontier may be those who are innately dissatisfied with the status quo and, being deprived of new challenges, may have a tendency toward depression and an elevated risk of suicide. As noted above, a much weaker latitudinal effect may have an impact on inhabitants of northern states. In addition, the suicide rate is probably affected by regional societal attitudes toward people with mental illness.
Although many genetic and environmental factors affect the suicide rate, the organizational structure of behavioral health services appears to play a significant role. The results of this study suggest that the proper allocation of funds between state hospitals and community-based facilities is important in minimizing the suicide rate.
Dr. Davis is an internist affiliated with the Augusta Mental Health Institute, Box 724, Augusta, Maine 04332 (e-mail, [email protected]). Dr. Lowell is director of information services at the Maine Department of Behavioral and Developmental Services in Augusta. Steven S. Sharfstein, M.D., is editor of this column.

Figure 1. Relationship between the level of funding for state hospitals and the suicide rate in fiscal year 1997a
a For categorization by sector, states were classified by whether their level of funding varied by more than 12 percentage points above or below the optimum level of 43 percent and by whether their suicide rate was above or below the national mean of 13 per 100,000 populationRegression formula, y=1.0099x + .4795; R2=.0783.
 |
Table 1. Variations among states from a theoretical optimum level of funding for state hospitals and variations in the suicide rate, bymedian per capita incomea
a The optimum expenditure level was calculated to be 43 percent of available state funds for the public portion of behavioral health careStates are classified by whether their suicide rate is above or below the national mean of 13 per 100,000 population.
 |
Table 2. Number of states in four sectors based on the level of funding for state hospitals and the suicide rate, by median per capita income
1. Davis G, Lowell W: Using artificial neural networks and the Gutenberg-Richter power law to "rightsize" a behavioral health care system. American Journal of Medical Quality 14:216-228, 1999Crossref, Medline, Google Scholar
2. Deming WE: Out of the Crisis. Cambridge, Mass, MIT Center for Advanced Engineering Study, 1992Google Scholar
3. National Association of State Mental Health Program Directors Research Institute: Funding Sources and Expenditures of State Mental Health Agencies. Alexandria, Va, 2000. Available at www.rdmc.org/nripms/1999StateProfiles.aspGoogle Scholar
4. Kettl PA, Collins T, Sredy M, et al: Seasonal differences in suicide birth rate in Alaska Natives compared to other populations. American Indian and Alaska Native Mental Health Research 8(1):1-10, 1997Google Scholar
5. Regional variations in suicide rates: United States, 1990-1994. Morbidity and Mortality Weekly Report 46:789-793, 1997Medline, Google Scholar


